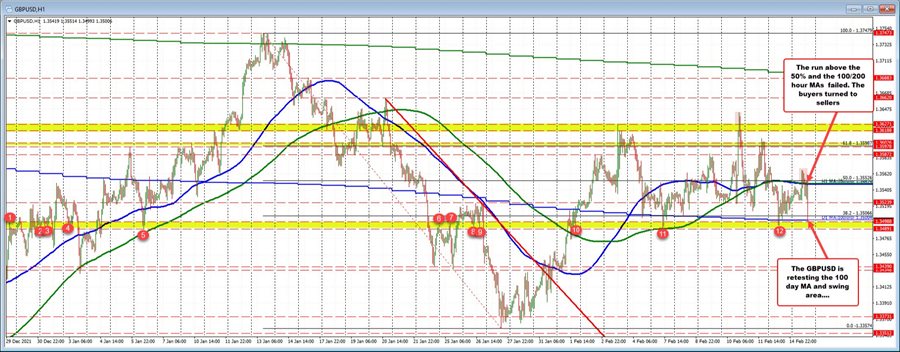
The GBPUSD moved above a cluster of resistance target on the upside in the London/European session, including the 100 and 200 hour moving averages and the 50% midpoint of the 2022 trading range. All came within a few pips of each other between 1.3548 and 1.35526..
The price high moved up to 1.3566, but rotated back down toward lows technical levels. After breaking back below, the area became resistance once again. Then the last hours of trading as seen the buyers turned sellers, and the price extending lower.
The pair is currently down testing the 100 day moving average 1.34999, along with a swing area between 1.3489 and 1.34968. As I type the price just moved to 1.3488 but currently trades back at 1.3494. A move below the 1.3489 level with momentum should open up the door for further selling with not a lot of support until 1.3430 to 1.3439 (interim support at 1.3460 area).
