The GBPUSD moved lower after the budget was released early, but has now moved to new highs.
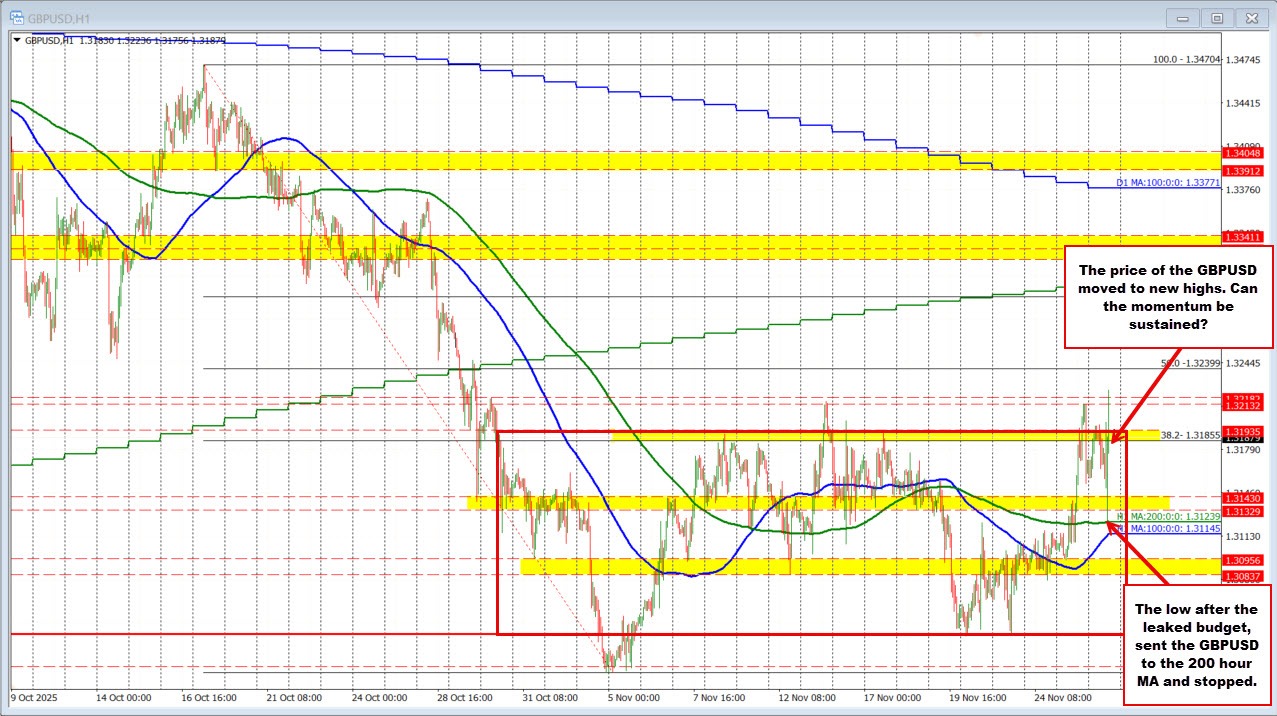
Technically, the price initially moved lower, but found support buyers against its 200 hour moving average at 1.31239 (green line on the chart above). That was above the 100 hour moving average at 1.31145 (blue line). The price bounced off that low as the Chancellor presented the budget. The momentum took the GBPUSD above the 38.2% retracement of the move down from the mid-October high at 1.31855 . Short-term traders will be watching at 38.2% retracement for support now.
The price of the GBPUSD has traded mostly between 1.3038 up to 1.3193 since the end of October.
The high price today extended above that range and also the recent highs including the high from yesterday near 1.3213, the high from November 13 at 1.32134, and the high going back to October 30 at 1.1318. The price moved to 1.3222 before rotating back to the downside. That is a little disappointing and makes that area a key target to get above and stay above.
The current price is back down testing the 38.2% retracement level. Can the buyers hold support here and keep the bullish bias intact at least in the short term? That is what will be decided in the short term today. Move back into the "red box" and we could see the buyers turn to sellers and move the price back toward the lower MAs over time.
