USD
- The Fed left interest rates unchanged as expected at the last meeting and dropped the tightening bias in the statement.
- The US PCE came in line with expectations.
- The US Jobless Claims missed expectations although the data is still in the recent ranges.
- The latest US PMIs increased further from the prior month with the Manufacturing PMI beating expectations and the Services PMI missing.
- The US Consumer Confidence missed expectations across the board.
- The market expects the first rate cut in June.
GBP
- The BoE left interest rates unchanged as expected at the last meeting removing the tightening bias but reaffirming that they will keep rates high for sufficiently long to return to the 2% target.
- The employment report beat expectations across the board with a positive revision to the December’s negative payroll figure.
- The UK CPI missed expectations across the board but with Services inflation remaining sticky, which continues to support the BoE’s patient stance.
- The latest UK PMIs improved from the prior month with the Services PMI beating expectations and the Manufacturing PMI missing.
- The latest UK Retail Sales beat expectations across the board by a big margin.
- The market expects the first rate cut in June.
GBPUSD Technical Analysis – Daily Timeframe
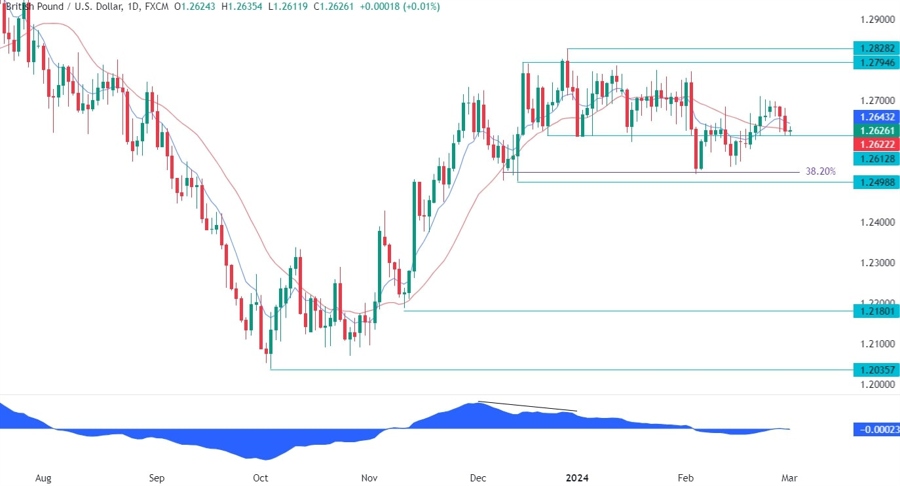
On the daily chart, we can see that GBPUSD continues to trade inside the range with a choppy price action. The pair fell into the key 1.2612 level yesterday where we can also find the red 21 moving average for confluence. This is where we can expect the buyers to step in with a defined risk below the level to position for a rally into the 1.28 handle. The sellers, on the other hand, will want to see the price breaking lower to pile in and target a drop into the 1.25 support.
GBPUSD Technical Analysis – 4 hour Timeframe
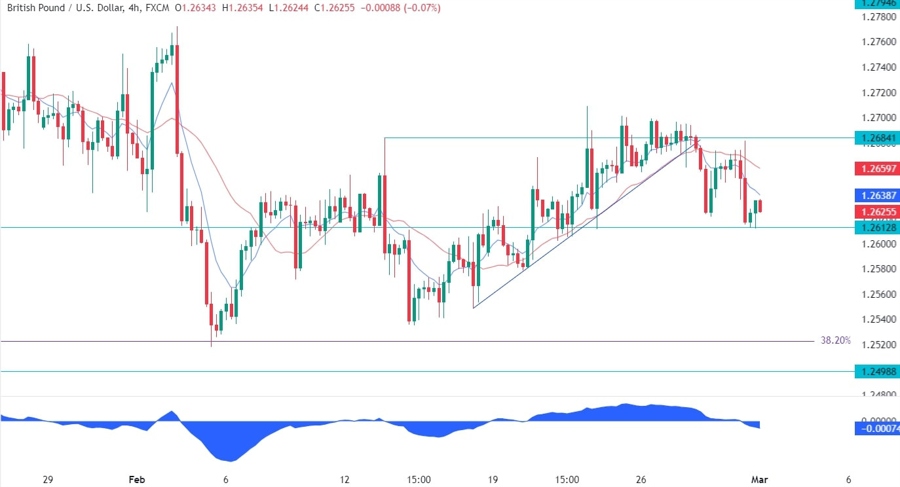
On the 4 hour chart, we can see that the pair couldn’t break above the 1.2685 level and as soon as the price broke through the upward trendline, the sellers piled in to position for a drop into new lows. The bias is now skewed to the downside, but we could have a smaller range between the 1.2612 support and the 1.2685 resistance. A break on either side should lead to a sustained move in the direction of the breakout.
GBPUSD Technical Analysis – 1 hour Timeframe
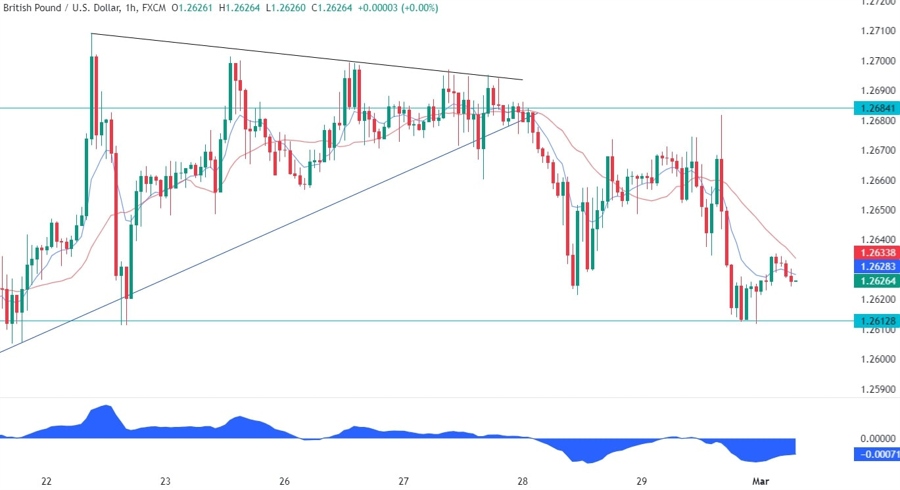
On the 1 hour chart, we can see more closely the recent price action with the latest bounce on the 1.2612 support. Watch out for the data today as it might lead to a breakout.
Upcoming Events
Today the only notable event will be the release of the US ISM Manufacturing PMI.


