USD
- The Fed left interest rates unchanged as expected at the last meeting while dropping the tightening bias in the statement but adding a slight pushback against a March rate cut.
- The US CPI beat expectations for the second consecutive month with the disinflationary trend reversing.
- The US PPI beat expectations across the board by a big margin.
- The US Jobless Claims beat expectations with the data remaining steady.
- The latest US PMIs increased further from the prior month with the Manufacturing PMI beating expectations and the Services PMI missing.
- The US Retail Sales missed expectations across the board by a big margin.
- The market now expects the first rate cut in June.
GBP
- The BoE left interest rates unchanged as expected at the last meeting removing the tightening bias but reaffirming that they will keep rates high for sufficiently long to return to the 2% target.
- The employment report beat expectations across the board with a positive revision to the December’s negative payroll figure.
- The UK CPI missed expectations across the board but with Services inflation remaining sticky, which continues to support the BoE’s patient stance.
- The latest UK PMIs improved from the prior month with the Services PMI beating expectations and the Manufacturing PMI missing.
- The latest UK Retail Sales beat expectations across the board by a big margin.
- The market expects the first rate cut in June.
GBPUSD Technical Analysis – Daily Timeframe
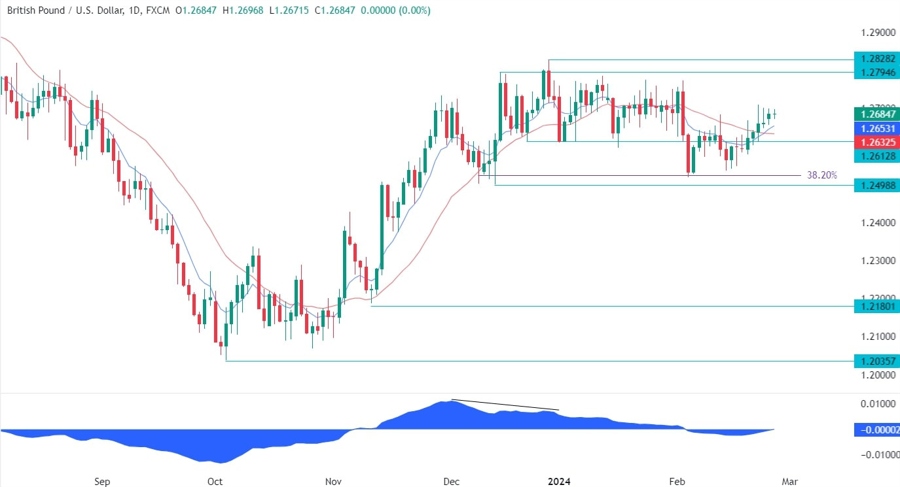
On the daily chart, we can see that GBPUSD continues to trade inside the range with a choppy price action. This is one of the worst market environments as traders can get whipsawed on either direction. There’s not much to glean from this chart, so we need to zoom in to see some more details.
GBPUSD Technical Analysis – 4 hour Timeframe
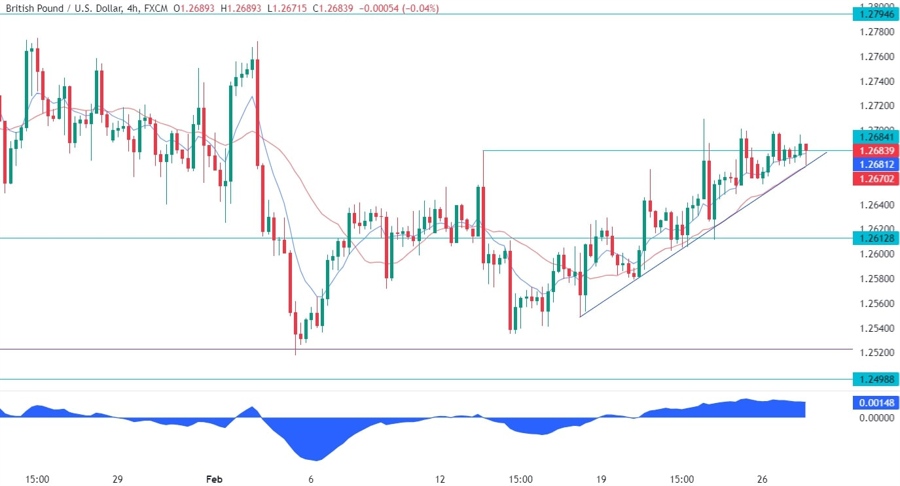
On the 4 hour chart, we can see that we have a strong resistance at the 1.2685 level which is the high of the hot US CPI release. We can also see that we have an upward trendline defining the current uptrend where the buyers have been leaning onto to position for higher highs. This is exactly where we can expect them to step in again as they will also find the red 21 moving average for confluence. The sellers, on the other hand, will want to see the price breaking lower to invalidate the bullish setup and position for a drop into the 1.25 support.
GBPUSD Technical Analysis – 1 hour Timeframe
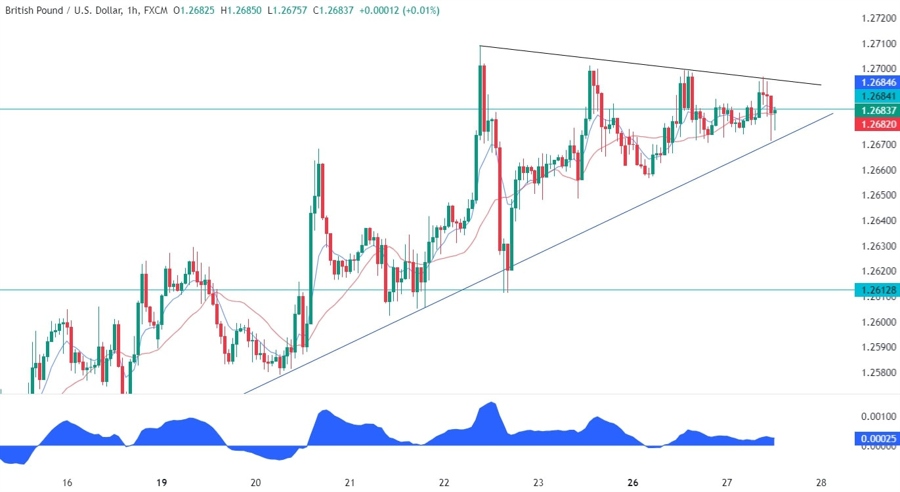
On the 1 hour chart, we can see more closely the recent price action with the multiple failed breakouts of the 1.2685 resistance. What happens here will likely decide where the pair will go in the next few days as a successful break to the upside should lead to a rally into the 1.28 handle, while a break to the downside will likely trigger a selloff into the 1.25 level.
Upcoming Events
This week we have some important economic data on the agenda. We begin today with the release of the US Consumer Confidence report. On Thursday, we will see the US PCE and the latest US Jobless Claims figures. Finally, on Friday, we conclude the week with the US ISM Manufacturing PMI.


