USD
- The Fed left interest rates unchanged as expected at the last meeting and dropped the tightening bias in the statement.
- The US PCE came in line with expectations.
- The US Jobless Claims missed expectations although the data is still in the recent ranges.
- The latest US ISM Manufacturing PMI missed expectations by a big margin.
- The US Consumer Confidence missed expectations across the board.
- The market expects the first rate cut in June.
GBP
- The BoE left interest rates unchanged as expected at the last meeting removing the tightening bias but reaffirming that they will keep rates high for sufficiently long to return to the 2% target.
- The employment report beat expectations across the board with a positive revision to the December’s negative payroll figure.
- The UK CPI missed expectations across the board but with Services inflation remaining sticky, which continues to support the BoE’s patient stance.
- The latest UK PMIs improved from the prior month with the Services PMI beating expectations and the Manufacturing PMI missing.
- The market expects the first rate cut in June.
GBPUSD Technical Analysis – Daily Timeframe
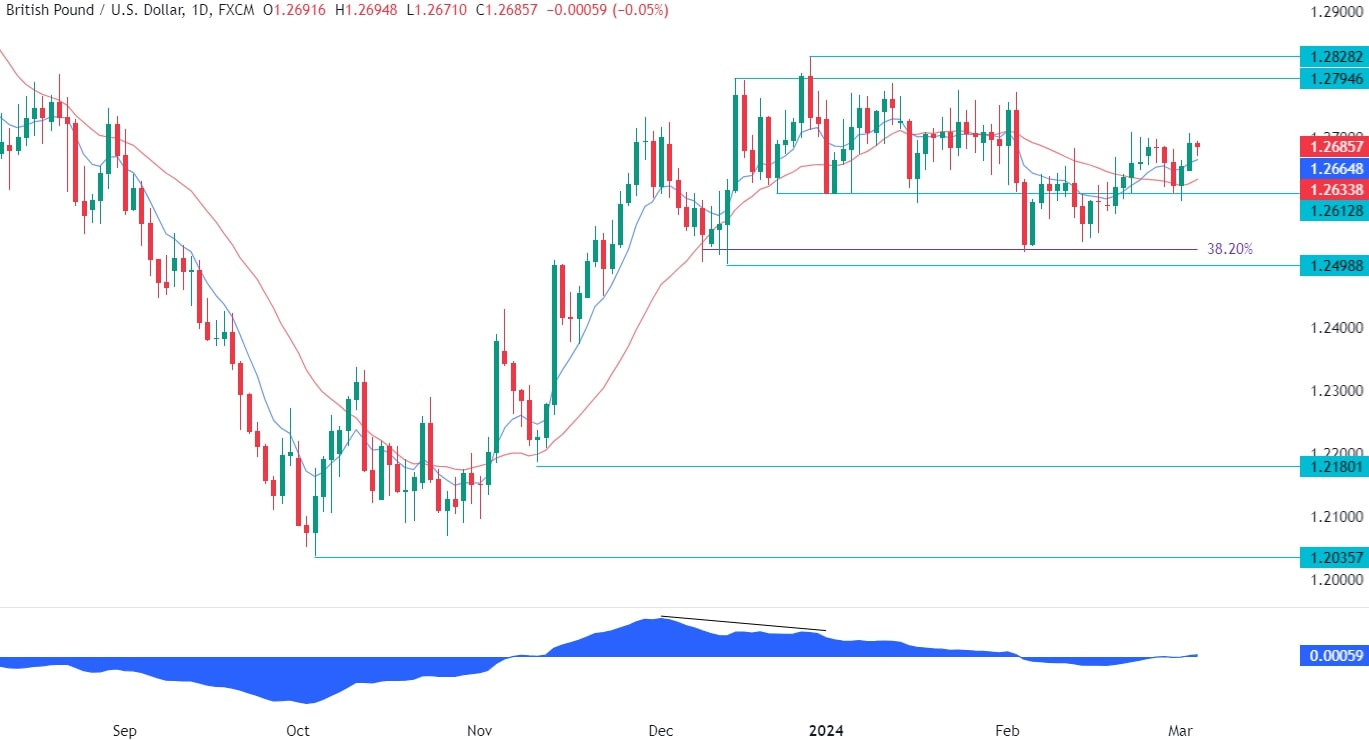
On the daily chart, we can see that GBPUSD continues to trade inside the range with a bullish bias as the price has been printing higher highs and higher lows lately. The pair recently fell into the 1.2612 support where we had also the red 21 moving average for confluence. The price bounced strongly following the big miss in the US ISM Manufacturing PMI and rallied all the way back to the recent high around the 1.27 handle. There’s not much else to glean from this chart so we need to zoom in to see some more details.
GBPUSD Technical Analysis – 4 hour Timeframe
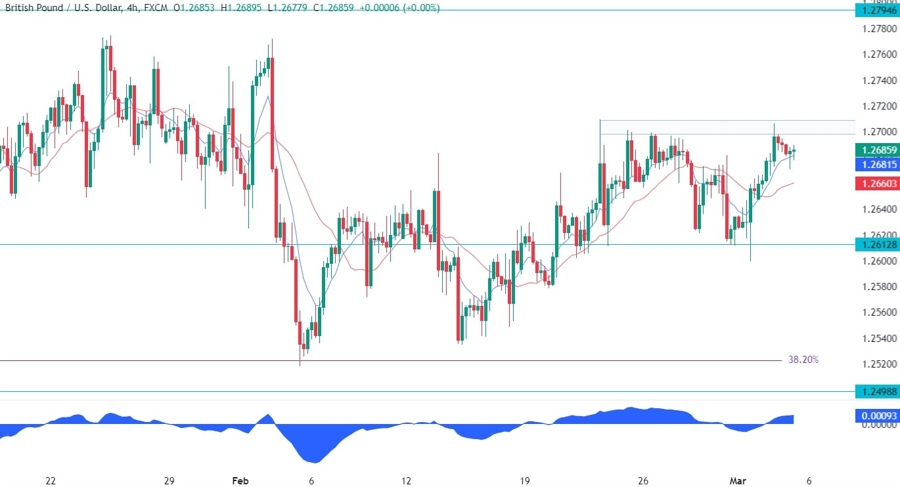
On the 4 hour chart, we can see more clearly the key resistance zone around the 1.27 handle where the sellers have been stepping in for a couple of weeks now. We have this mini range between the 1.2612 support and the 1.27 resistance that the pair will need to break before we start to look at the next targets. We can expect though that a break to the upside should lead to a rally into the 1.28 resistance, while a break to the downside is likely to trigger a selloff into the 1.25 support.
GBPUSD Technical Analysis – 1 hour Timeframe
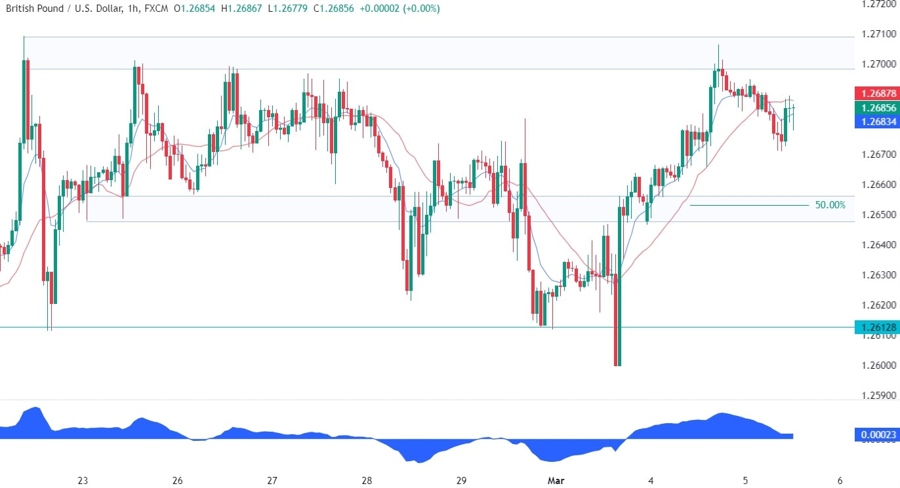
On the 1 hour chart, we can see that we have another interesting zone around the 1.2650 level where the price reacted to for several times in the past couple of weeks. This is where we can expect the buyers to step in with a defined risk below it to position for a rally into the 1.27 handle targeting a breakout. The sellers, on the other hand, will want to see the price breaking lower to pile in and target a break below the 1.2612 support.
Upcoming Events
This week we have lots of important events on the agenda with the release of the US labour market data and the Fed Chair Powell testifying to Congress. We begin today with the US ISM Services PMI. Tomorrow, we have the US ADP, the US Job Openings and the Fed Chair Powell speaking. On Thursday, we get the latest US Jobless Claims figures, while on Friday we conclude the week with the US NFP report.


