USD
- The Fed left interest rates unchanged as expected at the last meeting while dropping the tightening bias in the statement but adding a slight pushback against a March rate cut.
- The US CPI beat expectations for the second consecutive month with the disinflationary trend reversing.
- The US PPI beat expectations across the board by a big margin.
- The US Jobless Claims beat expectations with the data remaining steady.
- The latest US PMIs increased further from the prior month with the Manufacturing PMI beating expectations and the Services PMI missing.
- The US Retail Sales missed expectations across the board by a big margin.
- The market now expects the first rate cut in June.
GBP
- The BoE left interest rates unchanged as expected at the last meeting removing the tightening bias but reaffirming that they will keep rates high for sufficiently long to return to the 2% target.
- The employment report beat expectations across the board with a positive revision to the December’s negative payroll figure.
- The UK CPI missed expectations across the board but with Services inflation remaining sticky, which continues to support the BoE’s patient stance.
- The latest UK PMIs improved from the prior month with the Services PMI beating expectations and the Manufacturing PMI missing.
- The latest UK Retail Sales beat expectations across the board by a big margin.
- The market expects the first rate cut in June.
GBPUSD Technical Analysis – Daily Timeframe
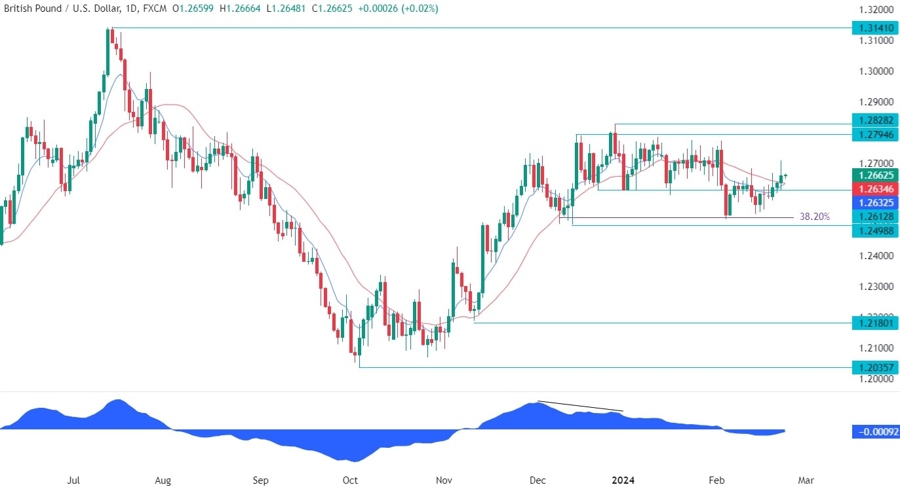
On the daily chart, we can see that GBPUSD continues to range but the price action lately has been pointing to a rally into the 1.28 resistance zone as the pair has been printing higher highs and higher lows. The recent break above the red 21 moving average reinforced further such a move as the sellers have no other key level to lean on at this point.
GBPUSD Technical Analysis – 4 hour Timeframe
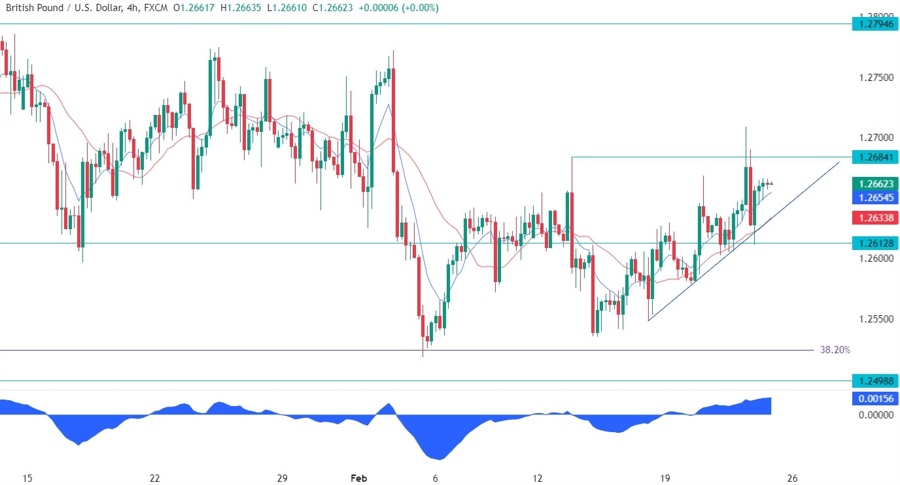
On the 4 hour chart, we can see that we got a strong rejection from the US CPI high around the 1.2685 level but the price bounced back from the trendline and the red 21 moving average as the buyers piled in with a better risk to reward setup. The sellers will need the price to break below the trendline to gain more conviction and position for a drop back into the lows.
GBPUSD Technical Analysis – 1 hour Timeframe
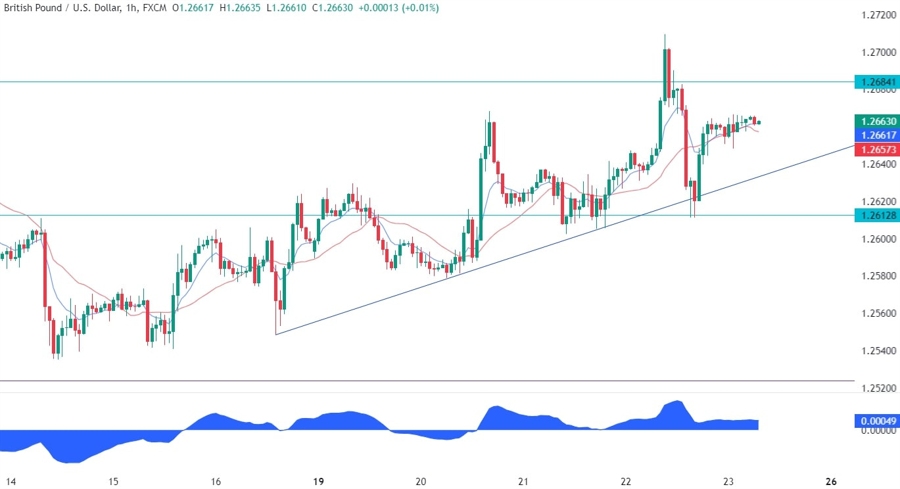
On the 1 hour chart, we can see more closely the recent price action with the strong rejection from the 1.2685 level and the bounce on the trendline. There’s not much to do here given that the price is now trading right in the middle of the key levels. If the price were to break the resistance, we can expect the buyers to increase the bullish bets into the 1.28 handle while the sellers will likely try to defend the level once again.


