US:
- The Fed hiked by 25 bps as expected and kept everything unchanged.
- Fed Chair Powell reaffirmed their data dependency and kept all the options on the table.
- The US economic data keeps on surprising to the upside, but inflation expectations and CPI readings continue to show disinflation with the last two Core CPI M/M figures coming in at 0.16%.
- The US PMIs missed expectations across the board last week, while the US Jobless Claims remained solid.
- Fed Chair Powell’s speech at the Jackson Hole Symposium was mostly in line with what he said previously but he stressed on the need to be careful going forward and that continued strength in the labour market may require further rate hikes.
- At the moment, the market doesn’t expect another hike from the Fed, but the next NFP and CPI data will be crucial to confirm or change this view.
UK:
- The BoE hiked by 25 bps as expected.
- The central bank seems to be leaning more on the less hawkish side as a key line in the statement was tweaked to indicate the propensity for a “higher for longer” stance rather than keeping with additional rate hikes.
- Recent key economic data like the latest employment report showed even more wage growth despite the unemployment rate ticking higher again, and the UK CPI beat expectations pointing to stagflation.
- The UK PMIs missed expectations across the board with the Services sector plunging into contraction.
- The market expects the BoE to hike by 25 bps in September.
GBPUSD Technical Analysis – Daily Timeframe
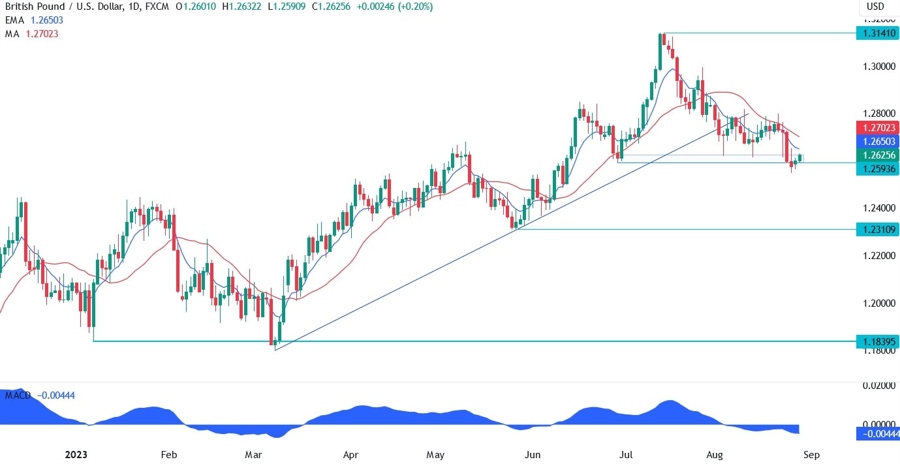
On the daily chart, we can see that GBPUSD has probed below the key support zone around the 1.2593 level but eventually turned around to get back above the level. The trend remains clearly bearish as the price has been printing lower lows and lower highs and the moving averages are crossed to the downside. We will need to see the pair rising above the 1.28 handle to confirm a new uptrend.
GBPUSD Technical Analysis – 4 hour Timeframe
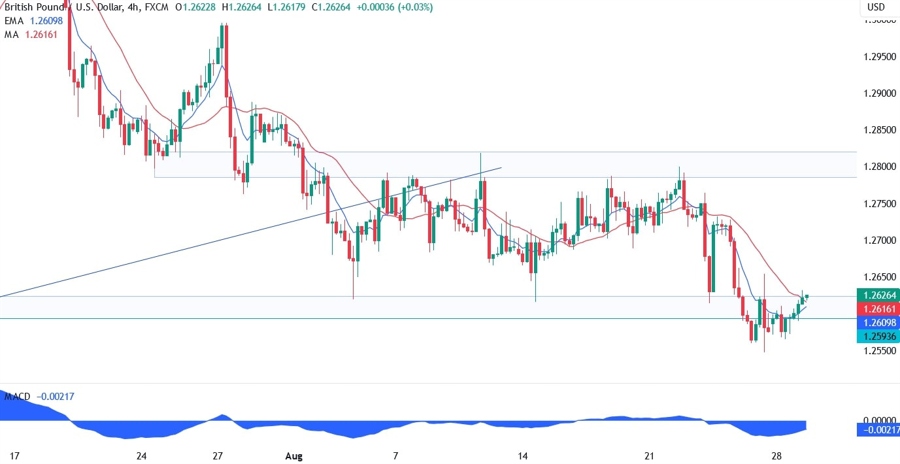
On the 4 hour chart, we can see that GBPUSD has been stuck in a range between the 1.26 support and the 1.28 resistance for almost the entire month. Last week we got the breakout, but the pair moved quickly back within the range leaving behind a fakeout. These are generally bullish signals so we can expect the buyers piling in here targeting the 1.28 resistance.
GBPUSD Technical Analysis – 1 hour Timeframe
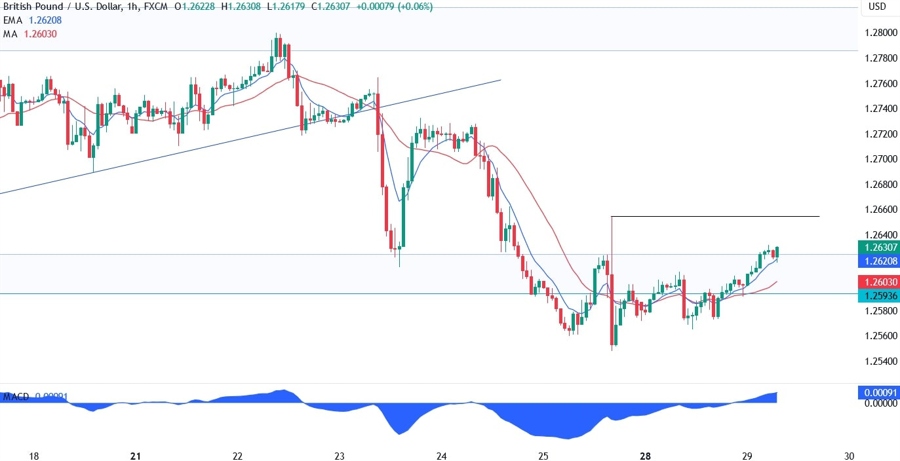
On the 1 hour chart, we can see that we have the last lower high at the 1.2654 level. The sellers are likely to step in there with a defined risk above the level and target another break below the support. The buyers, on the other hand, will need to break above the 1.2654 level to change the bearish short term trend into a bullish one and target the 1.28 resistance.
Upcoming Events
This week is an important one given that we will see many key labour market data for the US, including the NFP, before the next FOMC meeting. Today, we have the US Consumer Confidence and the US Job Openings reports. Tomorrow, we have the US ADP report. Moving on to Thursday, we will see the US Jobless Claims and the US PCE data. Finally, we conclude the week with the US NFP and the ISM Manufacturing PMI on Friday. Although the Fed keeps all the options on the table, it’s also leaning more towards a pause in September, so we will need strong data to make the market to expect a hike at the upcoming meeting.
See also the video below


