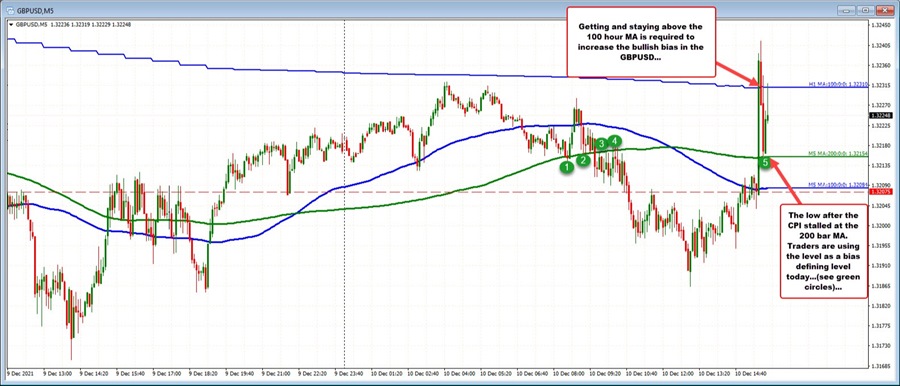
The GBPUSD spiked higher from 1.3207 to 1.32415 on the initial reaction to the US CPI (see the 5 minute chart above).
The move took the price above its 100 hour moving average at 1.3231. However the price quickly reversed back to the downside and has so far reached 1.32153.
Looking at the five minute chart above, that low level happens to be where the 200 bar moving average on the chart currently sits. Earlier today the price initially found support against that moving average then broke below it and used it as resistance (the green numbered circles in the chart above). So traders seem to be paying attention to it as a risk defining level. It would take a move below to increase the bearish bias further.
What next?
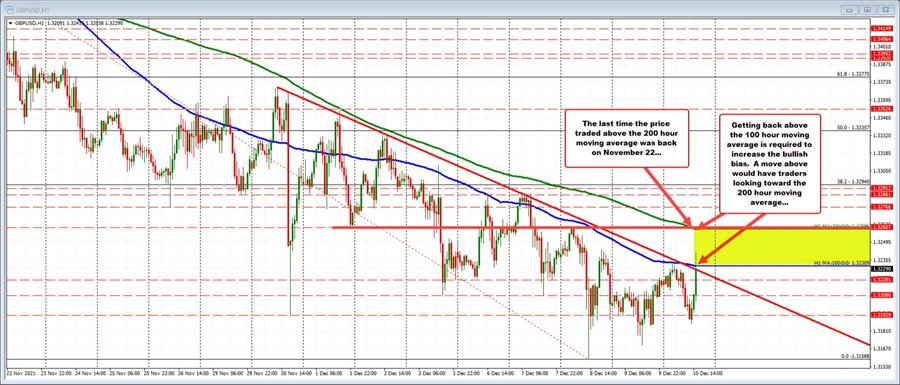
If the price is to move higher (lower dollar), the 100 hour moving average 1.3231 will need to be broken to shift the technical bias back to the upside.
Recall that on Tuesday, the price did move above that moving average over a six hourly bar stretch, but could not sustain momentum. The moving average is now lower than at that time making it a easier hurdle. Nevertheless, a move above would increase the bullish bias from a technical perspective.