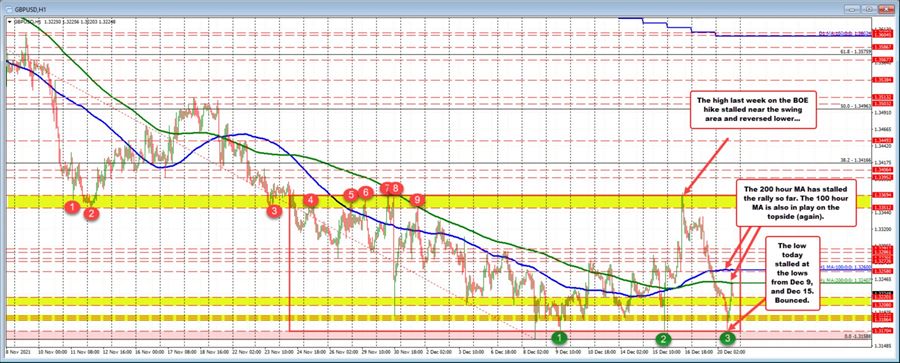
The GBPUSD has retraced its declines from the start of the day and in the process, returned back to its 200 hour moving average at 1.32407.
Last week the pair moved lower on Wednesday (FOMC day) and tested the swing low from December 9, and found support buyers. The price quickly retraced back higher.
On Thursday, the price continued the run to the upside, and in the process moved up to test the November 30 high price near 1.33694 (the high did reach 1.3373 before rotating back down).
Congruent with the up and down nature of the markets, on Friday, the price moved sharply back to the downside. In the process, the price fell below its 100 and 200 hour moving averages at 1.3260 and 1.32407 (blue and green lines currently).
Today, the pair opened up near its 200 hour moving average today and the sellers leaned pushing the price down to retest the December 9 and December 15 lows at 1.31704. Support buyers leaned against the lows and have pushed the price back up to the aforementioned 200 hour moving average.
So overall, a floor held support. On the topside, the moving average acted as resistance and held as well.
The current price is trading closer to the upper resistance level at 1.3226. There is some support at 1.3208 to 1.3220 which would be an interim technical clue. Stay above and the buyers - at least intraday - are making a play. Move below and the intraday sellers are more in control.
Having said that, the more intermediate technicals are more in favor of the sellers given the price has not been able to extend above the hourly moving averages. However with all the ups and downs since November 24, the bias nuances are influenced by the intraday clues as well.
The name of the game is to be flexible, but pick your technical spots and hope for the best.


