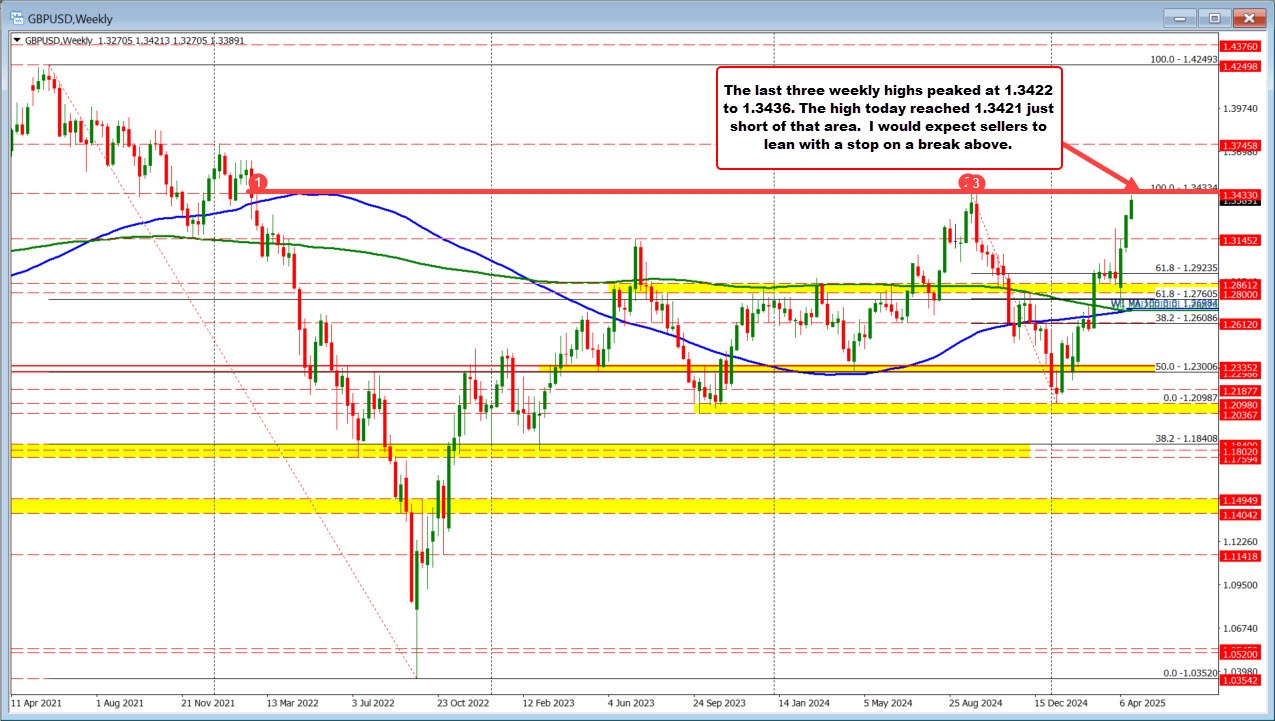
Looking back over time, the 1.3436 level—first reached on March 6, 2022—has consistently acted as a key resistance zone. The market approached this area again on September 22, peaking at 1.3433, and on September 23, with a high of 1.3423.
Today, nearly seven months later, GBPUSD pushed as high as 1.34213, falling just short of the lower boundary of that established swing zone between 1.3423 and 1.3436. Not surprisingly, the price has since rotated modestly lower from that area.
This zone continues to serve as a significant technical ceiling, and there is good reason for traders to show caution near this level. Since bottoming in the week of January 19, GBPUSD has trended steadily higher, nearly retracing its full 2024 decline.
With resistance clearly defined, traders are likely to lean against the 1.3436 area, using it as a level to define risk. Stops can be placed just above, making the risk relatively limited for those fading the rally.