The GBPUSD started the day right around its 100 day moving average currently at 1.3553.
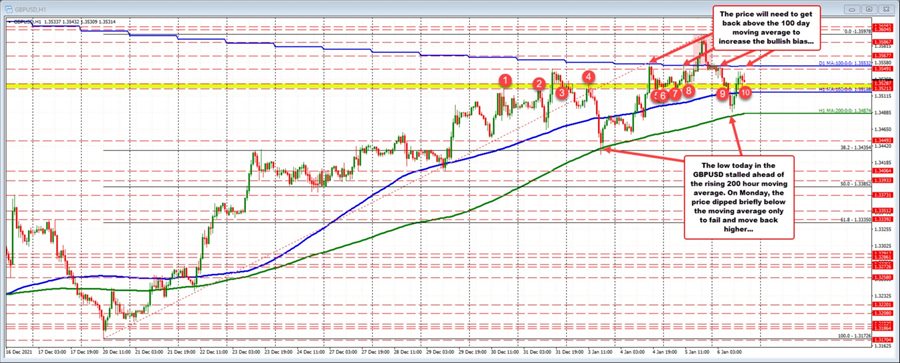
The Asian traders leaned against that level and pushed the price lower. The lower100 hour moving average was broken near 1.3517 (blue line), but the next target against the 200 hour moving average proved to be a more difficult undertaking.
The low price reached 1.3489. That was short of the rising 200 hour moving average (green line) which was near 1.3484 at the time (the moving average is now at 1.34874). Recall that on Monday, the price tested the 200 hour moving average and briefly moved below the level, only to reject the break and move back higher.
Today, the move back to the upside has taken the GBPUSD back toward the 100 day moving average. The high price in the London session has reach 1.35454. The current price is at 1.3532. It will take a move above the 100 day moving average to increase the bullish bias. In the meantime close support is back at the 100 hour moving average at 1.3518. A battle is on between the buyers and sellers with traders waiting for the next shove.
Ultimately on the downside, not only will it take a move below the 100 hour moving average, but also a move below the 200 hour moving average to increase the bearish bias.
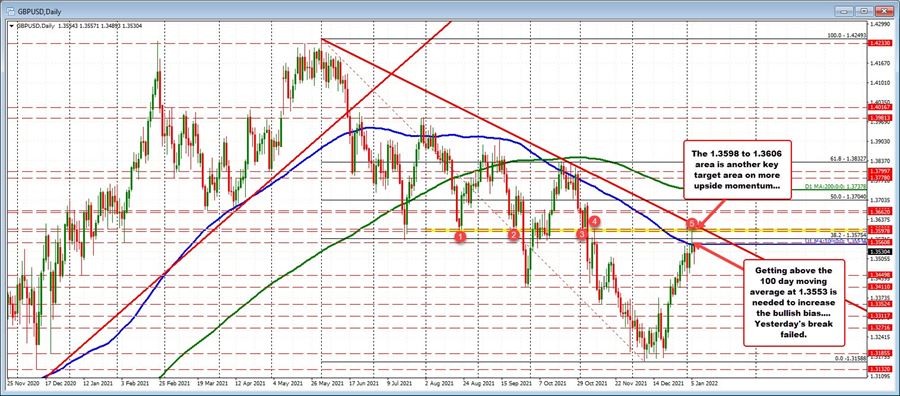
On the topside, getting and staying above the 100 day moving average (blue line on the daily chart below) would open the door toward the 1.3598 to 1.3606 area (red numbered circles in the daily chart below). Yesterday the high price stalled near that area.