UK:
- The BoE hiked by 25 bps as expected at the last meeting.
- The central bank seems to be leaning more on the less hawkish side as a key line in the statement was tweaked to indicate the propensity for a “higher for longer” stance rather than keeping with additional rate hikes.
- Key economic data like the latest employment report showed a very high wage growth despite the rising unemployment rate, and the UK CPI beat expectations the last month pointing to a stagflation.
- The UK PMIs recently missed expectations across the board with the Services sector plunging into contraction.
- The market expects the BoE to hike by 25 bps this week and then remaining on hold for an extended period of time.
Japan:
- The BoJ kept everything unchanged as expected at the last meeting but tweaked the YCC policy keeping the target band unchanged but giving more flexibility with a hard cap at 1.00%.
- The Japanese CPI data surprised to the upside recently with the core-core reading reaching again the previous high.
- The Unemployment Rate surprisingly increased recently, although it remains near cycle lows.
- BoJ Governor Ueda last week said that his focus is on a quiet exit from the monetary easing and added that the BoJ should have enough data by year end to decide how to proceed.
- The Japanese wage data last week showed a slowing in wage growth, and this is something the BoJ focuses on particularly.
GBPJPY Technical Analysis – Daily Timeframe
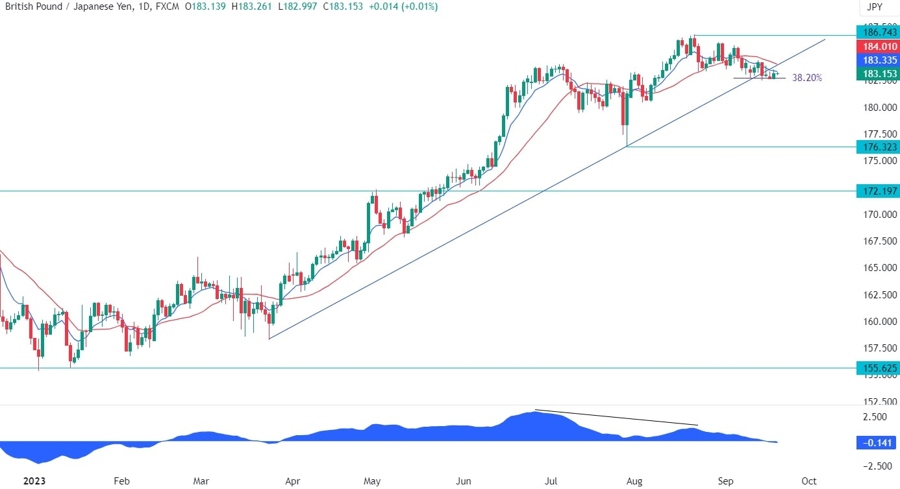
On the daily chart, we can see that we had a major divergence with the MACD which is generally a sign of weakening momentum often followed by pullbacks or reversals. In this case, the first target for the pullback was the trendline and the 38.2% Fibonacci retracement level. This is where the buyers are piling in with a defined risk below the Fibonacci level to target a new high. The price though is slowly breaking out and it’s not yet clear if this is going to be a fakeout or a real breakout. If the price falls below the Fibonacci support, we will likely see the sellers piling in even more aggressively and take the pair into the 176.32 level.
GBPJPY Technical Analysis – 4 hour Timeframe
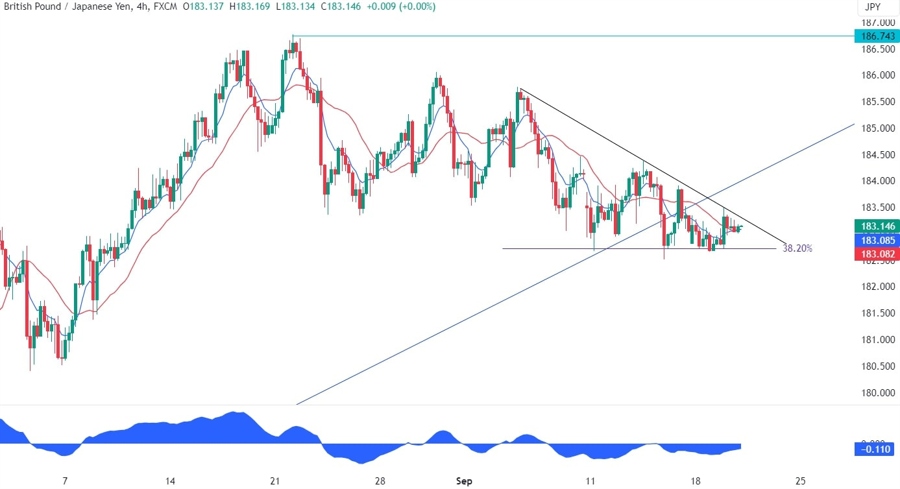
On the 4 hour chart, we can see that the recent price action seems to have formed a descending triangle. The price can break on either side of the pattern and what follows is generally a strong and sustained move in the direction of the breakout. So, if the price breaks to the upside, we should see the buyers piling in to position for a new high, but if it breaks to the downside, the sellers will target the 176.32 level.
GBPJPY Technical Analysis – 1 hour Timeframe
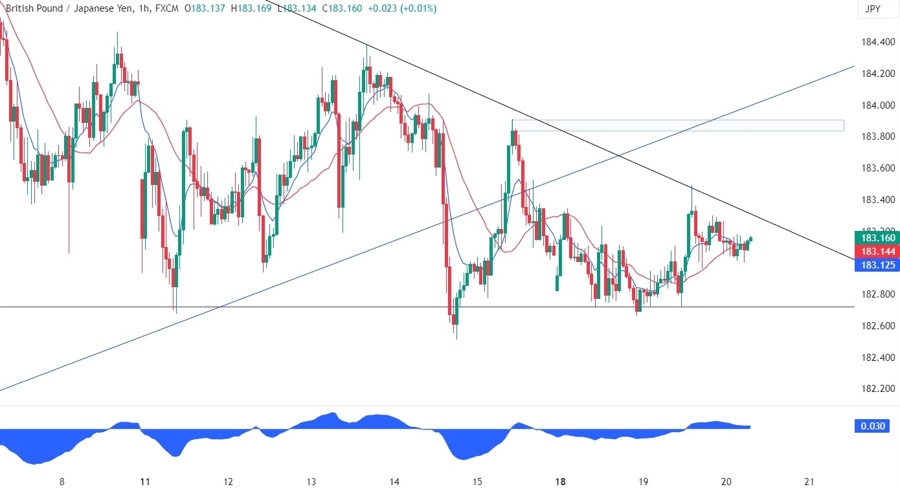
On the 1 hour chart, we can see that there’s nothing to do at the moment as the price is just messing around within the triangle. For more conservative buyers, a rally back above the trendline and the most recent swing high at 183.90 should confirm the resumption of the uptrend and give them more conviction to target a new high. Watch out for the UK CPI data this morning as we are likely to get a spike on either side depending on the outcome.
Upcoming Events
This week has some important economic releases with the BoE and BoJ rate decisions being the highlights. Today, we will see the latest UK CPI data, which is expected to impact the pound a lot as it will influence market’s expectation for the next BoE rate path. Tomorrow, the BoE is expected to hike by 25 bps with the market likely to be focused more on the forward guidance. On Friday, we will get the latest Japan CPI followed by the BoJ rate decision where the central bank is expected to keep everything unchanged. Later that day, we will also get the UK Retail Sales and PMIs data.


