GBP
- The BoE left interest rates unchanged as expected at the last meeting removing the tightening bias but reaffirming that they will keep rates high for sufficiently long to return to the 2% target.
- The employment report missed expectations with an uptick in the unemployment rate and an easing in wage growth.
- The UK CPI missed expectations across the board but with Services inflation remaining sticky, which continues to support the BoE’s patient stance.
- The latest UK PMIs improved from the prior month with the Services PMI beating expectations and the Manufacturing PMI missing.
- The market expects the first rate cut in June.
JPY
- The BoJ kept its monetary policy unchanged as expected at the last meeting with interest rates at -0.10% and the 10 year JGB yield target at 0% with 1% as a reference cap.
- The last Japanese CPI beat expectations although all measures eased further from the prior readings.
- The latest Unemployment Rate remained unchanged hovering around cycle lows.
- The Japanese PMIs improved for both the Manufacturing and Services measures although the former remains in contractionary territory.
- The Japanese wage data beat expectations by a big margin.
- The Tokyo CPI, which is seen as a leading indicator for National CPI, recently came in line with expectations with the measures increasing from the prior report.
- The market sees a 50/50 chance that the BoJ hikes rates in March.
GBPJPY Technical Analysis – Daily Timeframe
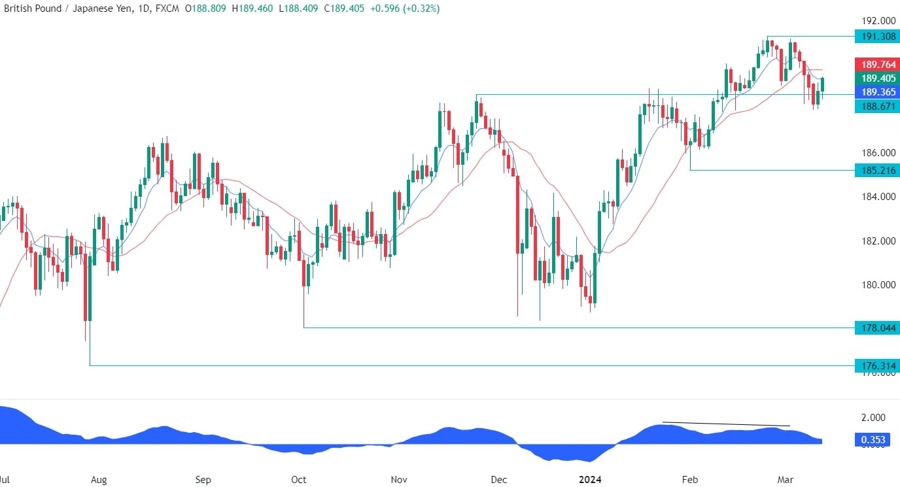
On the daily chart, we can see that GBPJPY is bouncing from the resistance turned support at 188.67. The sellers for now remain in control as market participants continue to position for the BoJ to exit the negative interest rates policy. We can also notice that the latest rally diverged with the MACD which is generally a sign of weakening momentum often followed by pullbacks or reversals. In this case, the target should be the base of the divergent formation around the 185.21 level. We can expect to find sellers around the red 21 moving average.
GBPJPY Technical Analysis – 4 hour Timeframe
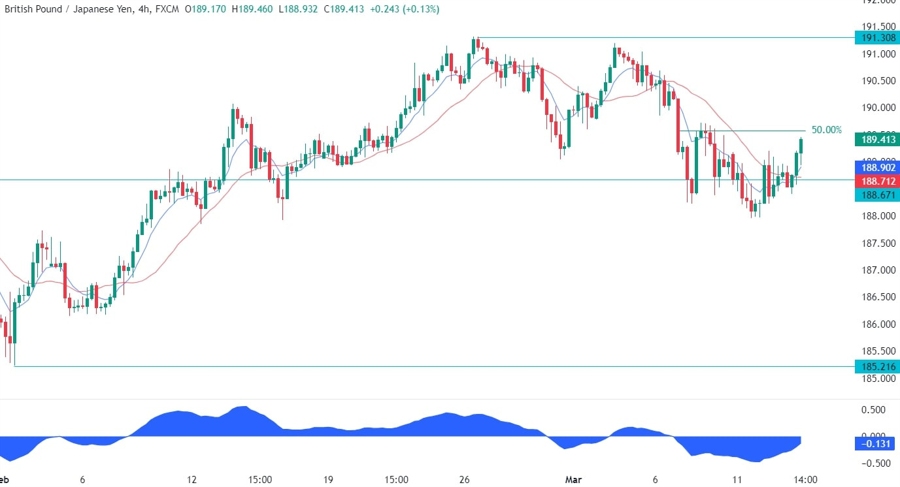
On the 4 hour chart, we can see that the price is approaching a key swing high level where we can also find the 50% Fibonacci retracement level and the daily 21 moving average for confluence. This is where we can expect the sellers to step in more aggressively with a defined risk above the swing high to position for a drop into new lows. The buyers, on the other hand, will want to see the price breaking higher to invalidate the bearish setup and increase the bullish bets into new highs.
GBPJPY Technical Analysis – 1 hour Timeframe
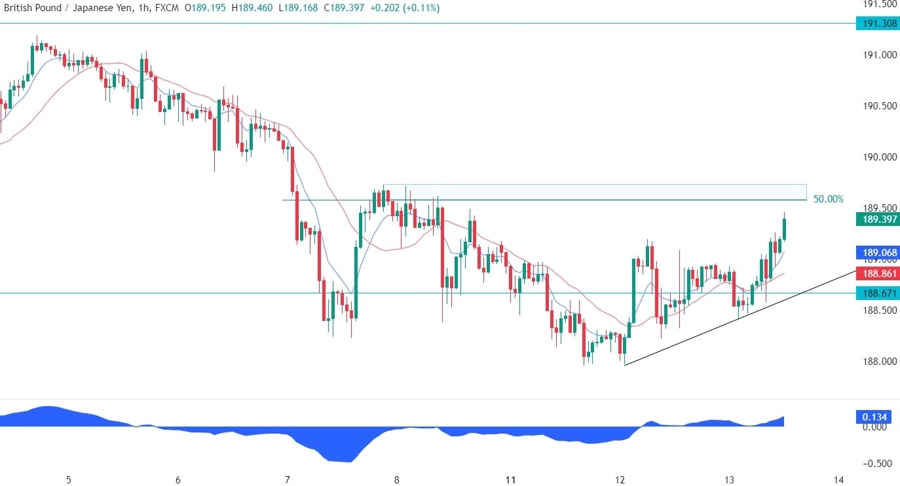
On the 1 hour chart, we can see more closely the recent price action with the price now basically at the resistance zone. If we get a strong rejection and the price breaks below the black counter-trendline, the sellers will have a confirmation for more downside and will likely increase the bearish bets into the 185.21 level. The buyers, on the other hand, should lean on the counter-trendline to position for a break above the resistance zone with a better risk to reward setup.
Upcoming Events
Tomorrow we get the US PPI, the US Retail Sales and the US Jobless Claims figures. On Friday, we conclude the week with the University of Michigan Consumer Sentiment survey.


