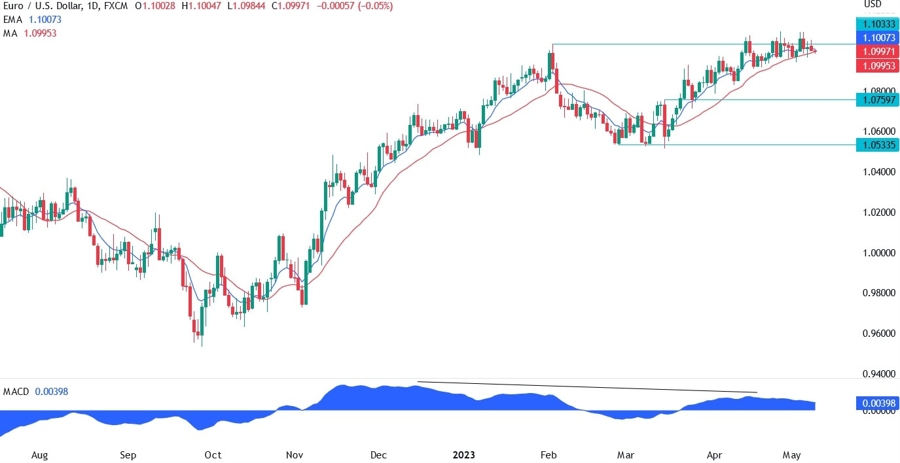
On the daily chart below for EURUSD, we can see that the price has tried multiple times to sustain a breakout of the 1.1033 resistance, but until now all tries have been unsuccessful. The buyers keep leaning on the red long period moving average hoping that at some point the resistance will give way, but the sellers are defending the level strongly.
The bullish momentum is weak though as depicted by the divergence with the MACD, so the buyers will need a strong bullish catalyst to succeed. Watch out for the red moving average because if the sellers manage to break through, we are likely to see a big selloff till the 1.0750 level.
EURUSD technical analysis
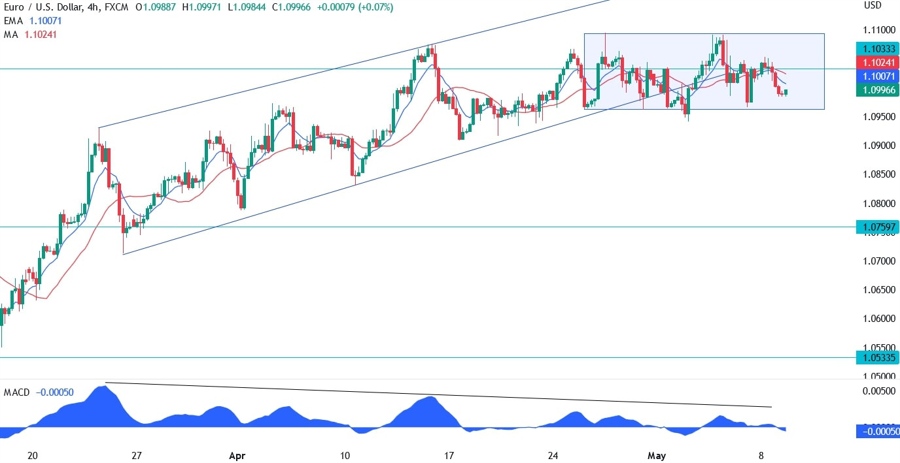
On the 4 hour chart below, we can see that the price has been trading within a rising channel. The whole rally though was diverging with the MACD, and the price has recently broken out of the channel.
This is generally a bearish signal, and the price often reverses back to the bottom of the channel, which in this case would be the 1.0750 support. Instead of falling straight away though, the price got stuck in a range between the 1.0960 support and the 1.1090 resistance. A breakout on either side should lead to a big move afterwards.
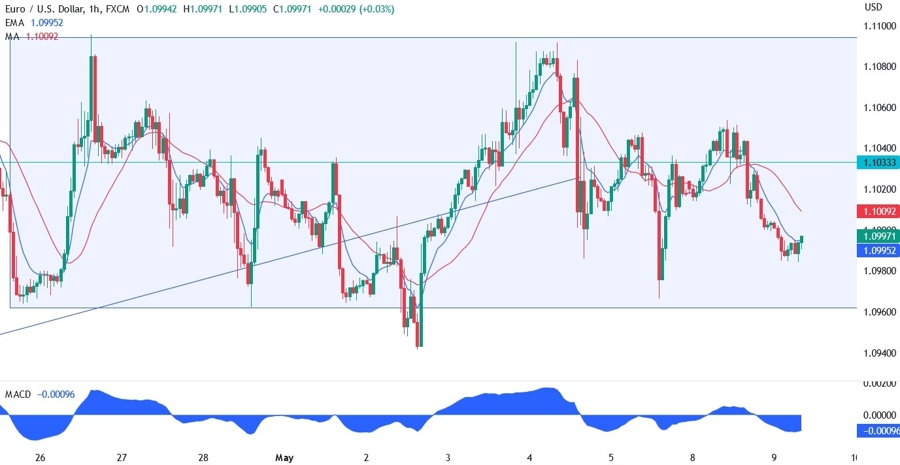
On the 1 hour chart below, we can see that the strong NFP report last Friday couldn’t give the sellers enough support for a breakout. In fact, the price bounced near the bottom of the range and it’s now just jumping around again. There isn’t much one can do in this environment other than waiting for a clear breakout on either side.
This is where many traders get chopped out. The next big event is the US CPI report tomorrow and it’s likely that a strong report will give the sellers enough momentum to break the support, while a weak one may give the buyers the chance to break the resistance.