US:
- The Fed left interest rates unchanged as expected at the last meeting.
- The macroeconomic projections were revised higher, and the Dot Plot showed that the FOMC still expects another rate hike by the end of the year with less rate cuts projected in 2024.
- Fed Chair Powell reaffirmed their data dependency but added that they will proceed carefully.
- The US CPI beat expectations on the headline figures, but the core measures came in line with forecasts and the market’s pricing barely changed.
- The labour market remains pretty resilient as seen once again last week with the beat inJobless Claims, although continuing claims missed for a second time in a row.
- The US Retail Sales last week beat expectations by a big margin with positive revisions to the prior figures, suggesting the consumers’ spending remains resilient.
- Fed Chair Powelland other FOMC members continue to highlight the rise in long term yields as doing the job for the Fed and therefore they are expected to keep rates steady in November as well.
- The market doesn’t expect the Fed to hike anymore.
EU:
- The ECB hiked by 25 bps at the last meeting and added a line in the statement that signalled the end of the tightening cycle.
- President Lagarde highlighted the slowdown in Eurozone economy and didn’t push back against the idea of them having reached already the terminal rate.
- The Eurozone CPI recently missed expectations across the board supporting the ECB’s stance.
- The labour market remains very tight with the unemployment rate hovering at record low levels.
- Overall, the economic data has been showing signs of fast deterioration in the economy, which gives the ECB another reason to keep rates steady.
- The ECB members are leaning towards keeping rates higher for longer now.
- The market doesn’t expect the ECB to hike anymore.
EURUSD Technical Analysis – Daily Timeframe
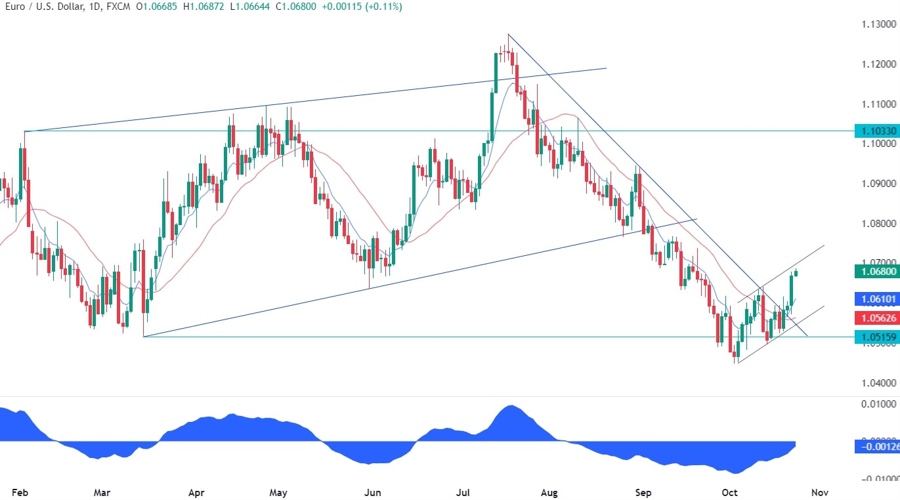
On the daily chart, we can see that the EURUSD pair eventually broke above the key trendline with the moving averages crossing to the upside. This has switched the bias more to the upside in the short-term, but we can also notice that it could just be a more complex correction that might end up forming a bearish flag. Yesterday’s rally has also overstretched a bit as depicted by the distance from the blue 8 moving average. In such instances, we can usually see a pullback into the moving average or some consolidation before the next move.
EURUSD Technical Analysis – 4 hour Timeframe
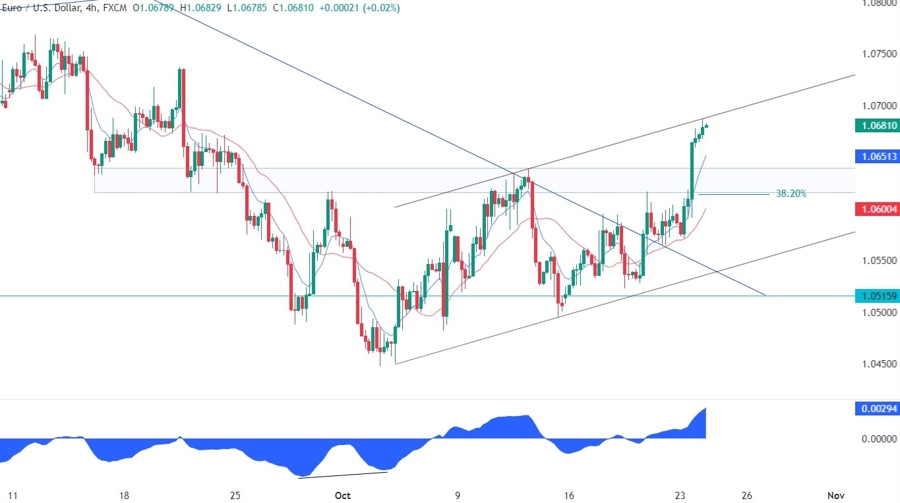
On the 4 hour chart, we can see that the price is rejecting the upper bound of the hypothetical bearish flag and we have a strong support zone around the 1.0620 level. From a risk management perspective, the buyers would be better off waiting for the price to pull back into the support as they will also find the confluence with the 38.2% Fibonacci retracement level and the red 21 moving average. The sellers, on the other hand, will want to see the price breaking below the support to increase the bearish bets into the lower bound of the flag and eventually aiming for a breakout.
EURUSD Technical Analysis – 1 hour Timeframe
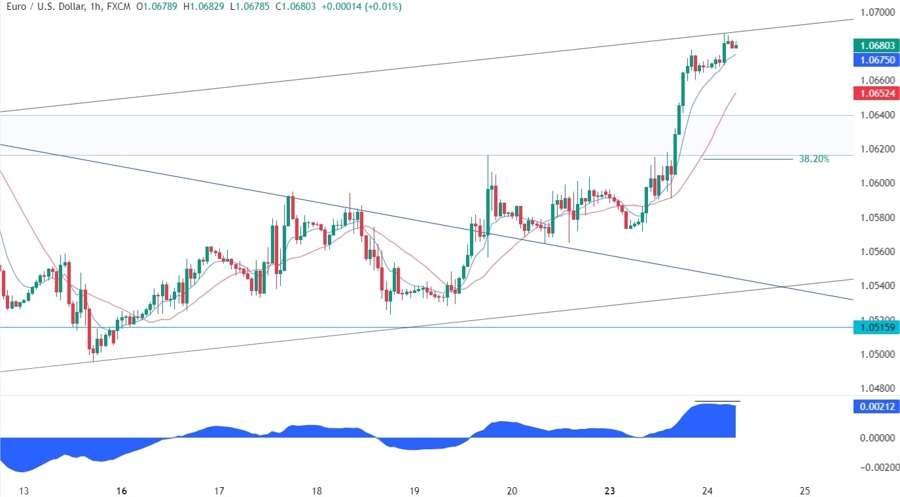
On the 1 hour chart, we can see that the price is diverging with the MACD right at the upper bound of the flag. This is generally a sign of weakening momentum often followed by pullbacks or reversals. In this case, it might be just another signal that confirms a pullback into the support.
Upcoming Events
Today we will get the latest PMIs for the Eurozone and the US. On Thursday, we will see the US Jobless Claims figures, while on Friday we get the US PCE report which is not expected to change anything for the Fed at this time.
See the video below


