USD
- The Fed left interest rates unchanged as expected at the last meeting with a shift in the statement that indicated the end of the tightening cycle.
- The Summary of Economic Projections showed a downward revision to Growth and Core PCE in 2024 while the Unemployment Rate was left unchanged. Moreover, the Dot Plot was revised to show three rate cuts in 2024 compared to just two in the last projection.
- Fed Chair Powell didn't push back against the strong dovish pricing and even said that they are focused on not making the mistake of holding rates high for too long.
- The latest US PCE missed expectations across the board with the Core 6-month annualised rate falling below the Fed’s target at 1.9%.
- The NFP report beat expectations although there was more weakness under the hood.
- The latest ISM Manufacturing PMI beat expectations, while the ISM Services PMI missed by a big margin.
- The hawkish Fed members have been leaning on a more neutral side lately.
- The market expects the Fed to start cutting rates in Q1 2024.
EUR
- The ECB left interest rates unchanged as expected at the last meeting maintaining the usual data dependent language.
- President Lagarde highlighted once again that the risks to the economy are skewed to the downside and that they did not discuss rate cuts, which was a pushback against the aggressive market’s rate cut pricing.
- The recent Eurozone CPI missed expectations with the disinflationary process remaining intact.
- The labour market remains historically tight with the unemployment rate hovering at cycle lows.
- The Eurozone PMIs missed expectations across the board with both the Manufacturing and Services sectors falling further into contraction.
- The ECB members continue to repeat that they will keep rates high for as long as necessary and that the market’s expectations are too aggressive.
- The market expects the ECB to start cutting rates in Q2 2024.
EURUSD Technical Analysis – Daily Timeframe
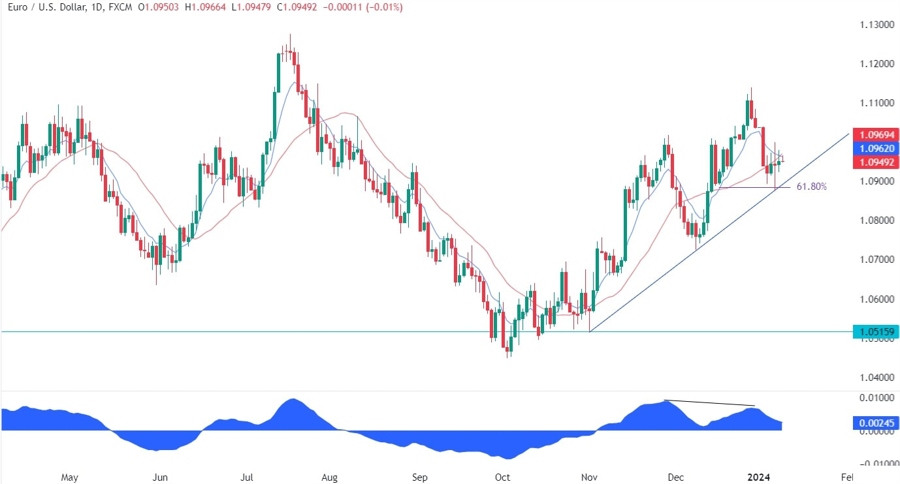
On the daily chart, we can see that EURUSD recently bounced on the key trendline around the 1.09 handle where we had also the 61.8% Fibonacci retracement level for confluence. This is where the buyers stepped in with a defined risk below the trendline to position for a rally into new highs. The sellers, on the other hand, will need the price to break below the trendline to invalidate the bullish setup and position for a drop into the 1.07 handle.
EURUSD Technical Analysis – 4 hour Timeframe
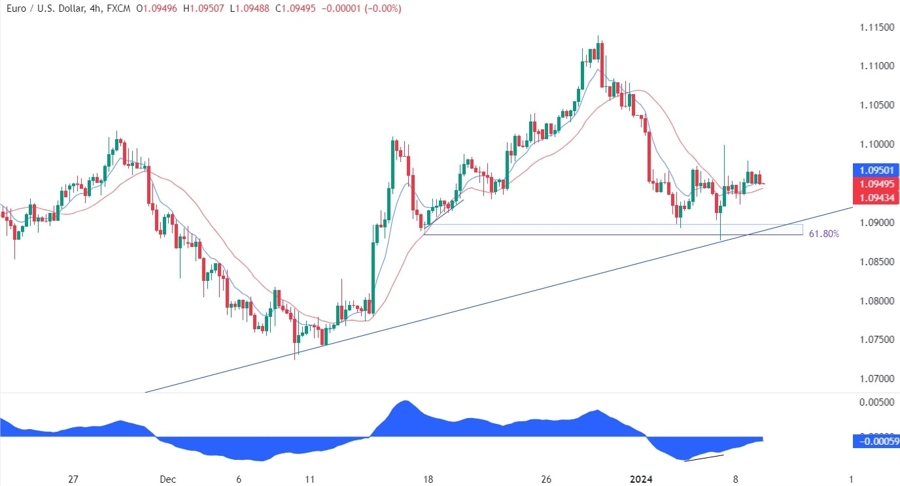
On the 4 hour chart, we can see that the latest leg lower into the trendline diverged with the MACD which is generally a sign of weakening momentum often followed by pullbacks or reversals. In this case, we got a pullback into the most recent swing high around the 1.0970 level where the pair started to consolidate. We can also notice that the moving averages have crossed to the upside which might be another bullish sign.
EURUSD Technical Analysis – 1 hour Timeframe
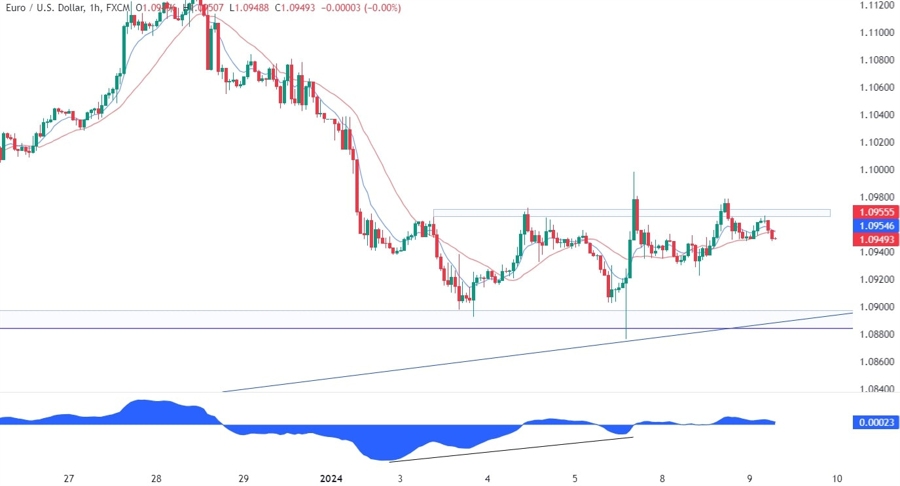
On the 1 hour chart, we can see more closely the current price action and the 1.0970 resistance zone. We now have this range between the 1.09 support and the 1.0970 resistance which gives us a clear setup:
- A break to the upside should see the pair extending the rally into the previous highs.
- A break to the downside is likely to trigger a selloff into the 1.07 handle.
Upcoming Events
Today we have the Eurozone Unemployment Rate on the agenda where the market will want to see how the labour market in the block is faring. On Thursday, we get the US CPI report and the US Jobless Claims figures, while on Friday we conclude the week with the US PPI data.


