The market is starting to price in a more hawkish path for the Fed as the economic data since the last FOMC meeting surprised consistently to the upside. Fed Chair Powell recently said that the majority of the FOMC expects two or more rates hikes this year if the data remains strong.
On the other hand, the ECB has basically pre-committed for a rate hike in July but what they are going to do in September is a much bigger debate. In fact, recent economic indicators for the Eurozone started to disappoint by big margins and point to a recession sometime in the second half of the year.
All else being equal, we may start to see the EURUSD pair drift lower as the market prices out the ECB rate hikes and prices in rate cuts.
EURUSD Technical Analysis – Daily Timeframe
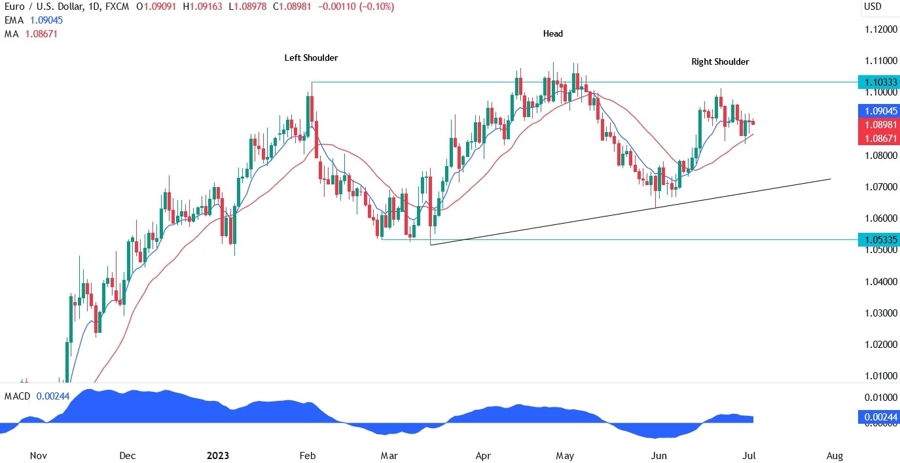
On the daily chart, we can see that we may have a major head and shoulders pattern on EURUSD with the black trendline as the neckline. The price might encounter the neckline somewhere in the 1.07 handle and a break lower would open the door for a major fall into the 1.02 handle. The moving averages at the moment are crossed to the upside keeping the uptrend intact. The red 21 moving average is acting as support for the buyers. If the price falls below the moving average, then we can expect more bearish momentum following and the price reaching the neckline.
EURUSD Technical Analysis – 4 hour Timeframe
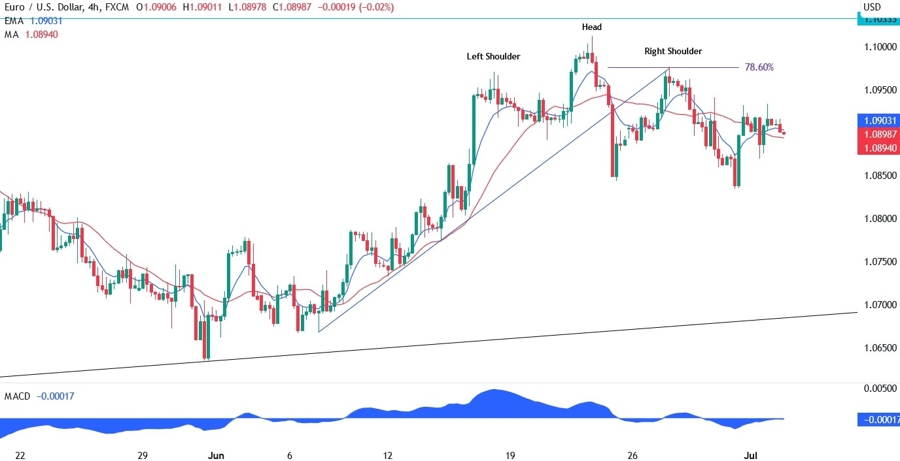
On the 4 hour chart, we can see that we may have another minor head and shoulders pattern formed right at the 1.10 handle. Technically, this is called a king’s crown pattern because the low of the right shoulder is lower than the low of the left shoulder. This is a stronger sign of a possible change in trend because the price has made a new lower low.
The head has also diverged with the MACD, which is generally a sign of weakening momentum often followed by pullbacks or reversals. The price then broke below the trendline and rallied back to retest it at the 78.6% Fibonacci retracement level. Overall, this is a perfect bearish setup, so if it fails, we are likely to see more higher highs as the bullish momentum must be strong at that point.
EURUSD Technical Analysis – 1 hour Timeframe
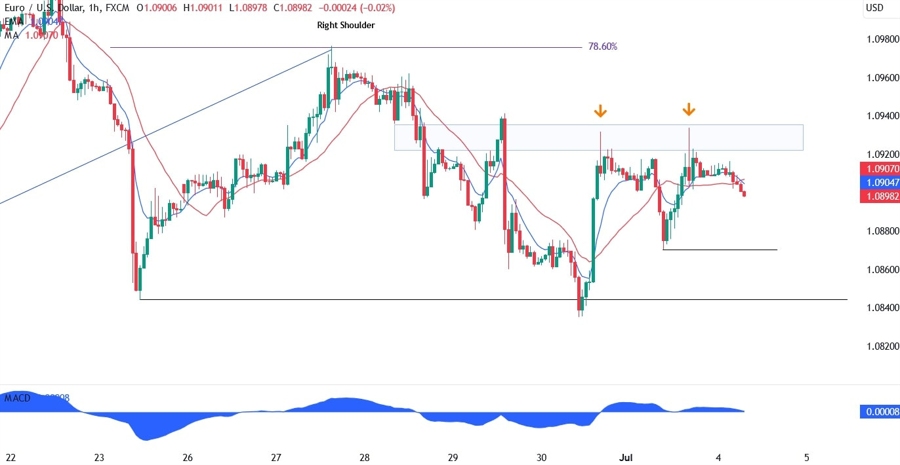
On the 1 hour chart, we can see that the price has made a double top at the 1.0930 resistance zone with the neckline standing at 1.0870. We have also a support level at the 1.0845, but it’s highly likely that we’ll see the support level break if the price breaks below the neckline as momentum sellers will start to pile in aggressively and push the price to new lower lows.
The buyers can either try an entry at the 1.0845 support with a defined risk below the level or wait for the price to break above the 1.0930 resistance zone to invalidate the bearish setup and target the 1.1033 level.
Upcoming Events
Today it’s a holiday in US for Independence Day, so the liquidity will be thinner. In the following days we’ll have some important economic data like the US Jobless Claims and ISM Services PMI on Thursday and the main event of the week: the US NFP report on Friday.
See also the video below:


