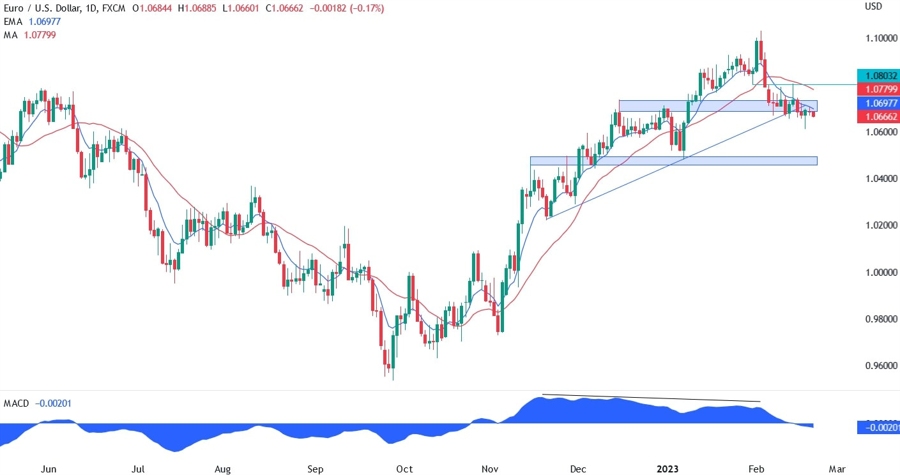
On the daily chart below, we can see that the price has breached both the trendline and the support zone at 1.07. There’s a clear fight between buyers and sellers as the price is consolidating near the breakout with a bearish tilt.
The whole move from 1.02 to 1.10 was diverging with the MACD signalling a loss of momentum. Generally, the price pulls back to the nearest support/resistance or trendline before returning to the original trend.
When the price breaks the trendline though, there are high chances that the price erases the entire divergent move. This would make the 1.02 as an ultimate target for this setup. The moving averages are pointing south and the red long period moving average acted as resistance along with the 1.08 handle.
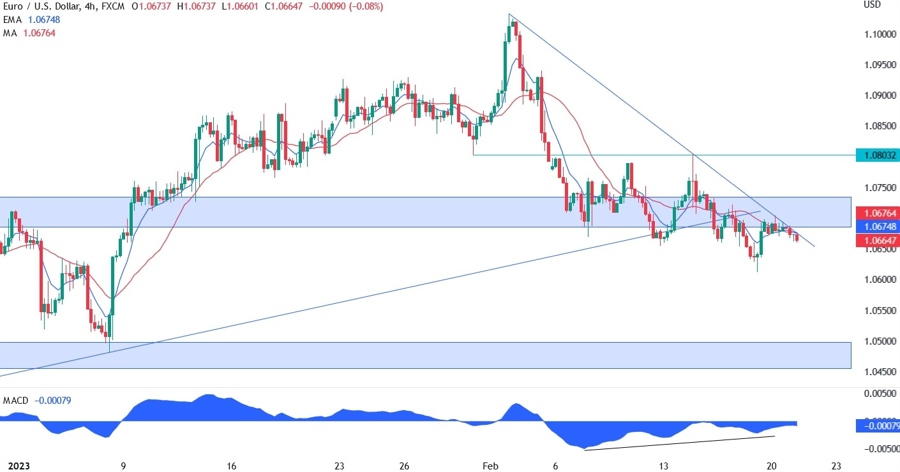
On the 4 hour chart below, we can see that the price has a bearish bias and it’s moving lower although very slowly. We can see that the selling momentum is waning with the MACD signalling a divergence. For now, the trendline is acting as resistance and the sellers are leaning on it. A break to the upside would give the buyers control and we may see another run to the 1.08 handle before finding sellers again.
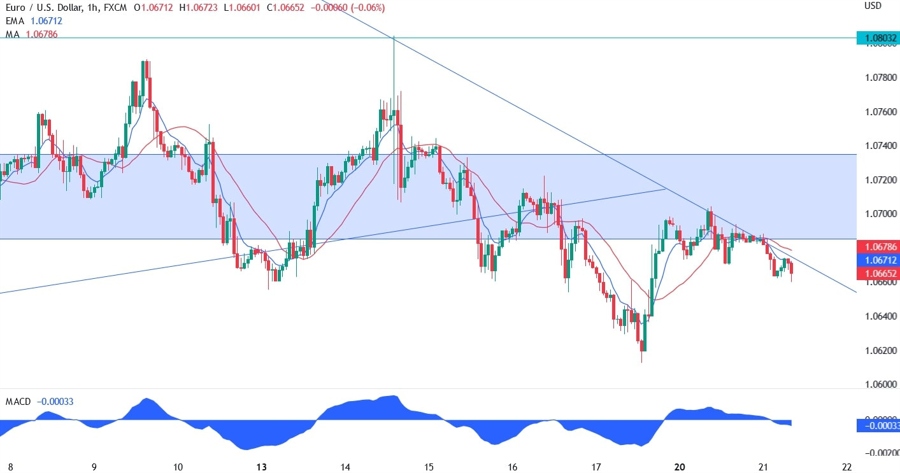
On the 1 hour chart below, we can see how the price is getting rejected by the downward trendline. The risk here is that these continuous rejections signal an imminent breakout to the upside as the price has now formed a bullish flag pattern. The target on a breakout would be the 1.08 handle.
The economic data will be key for what’s next for the pair. We are now in an environment where good news are bad news for the pair, therefore strong economic reports should be taken as bearish.