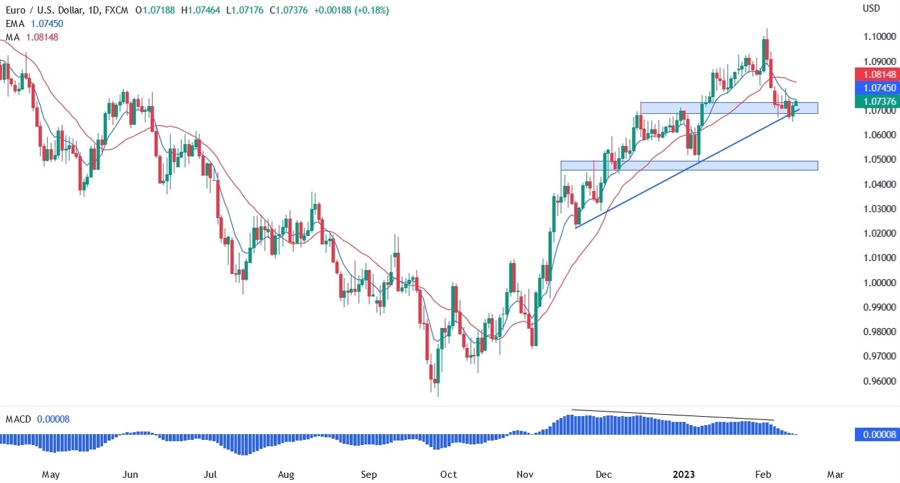
On the daily chart below, we can see that after the sell off out of the very strong NFP report, the price found support at the trendline.
Right now, the moving averages are pointing to a change in trend as the short period moving average is below the long period one. The price is likely to find resistance there, which would be in the 1.08 area.
The divergence between the price and the MACD has been pointing to a weakening upside momentum.
Generally, the price pulls back to the nearest support like a sing point or trendline before resuming the trend. If the price breaks down though, we should see a move all the way down to the base of the divergence at 1.02.
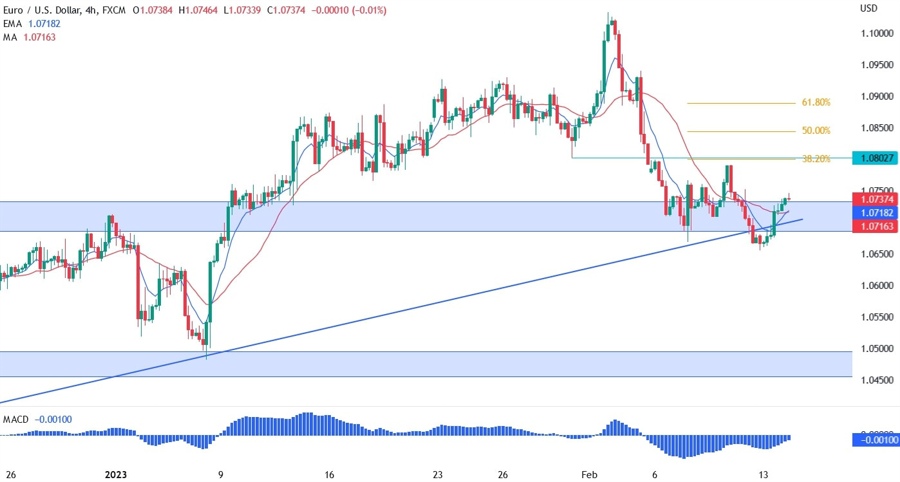
On the 4 hour chart below, we can see more closely the consolidation near the trendline as the market awaits the data. There’s a previous swing point resistance at 1.08 where we can also find the confluence with the 38.2% Fibonacci retracement level. This is going to be a strong level and the buyers will need to break it to target the 1.10 high.
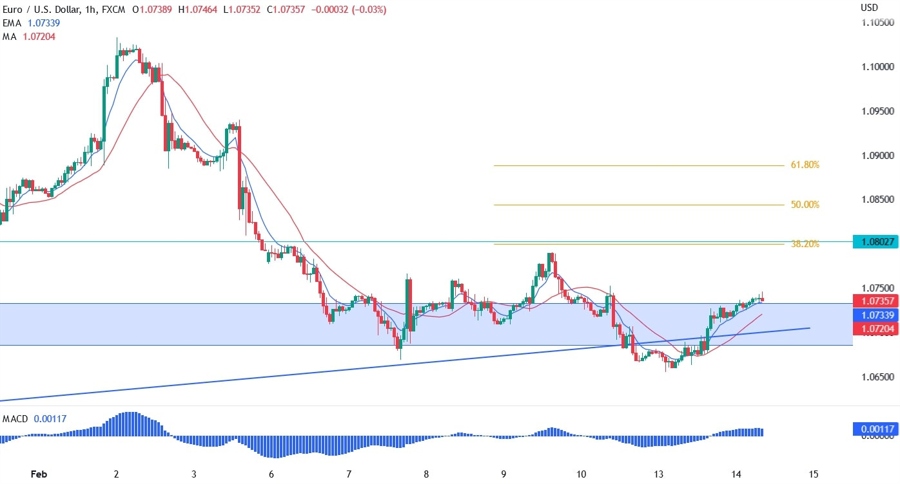
On the 1 hour chart below, the price action becomes murkier as it always does in a ranging environment. Right now, the moving averages are pointing to an upside move to the 1.08 level as the short period moving average is above the long period one, but it will all come down to the CPI report.
The levels though are pretty clear: get above the 1.08 resistance and the buyers should stay in control, on the other hand, get below the 1.0655 low and the sellers will target the 1.05 support.