The EURUSD is pushing higher, with buyers taking control after leaning against key support in the European session. The pair held firmly above its 100-hour moving average (1.15447), with the session low reaching 1.15473 just ahead of the North American open. That hold was technically significant—it gave buyers the green light to step back in and drive the price higher.
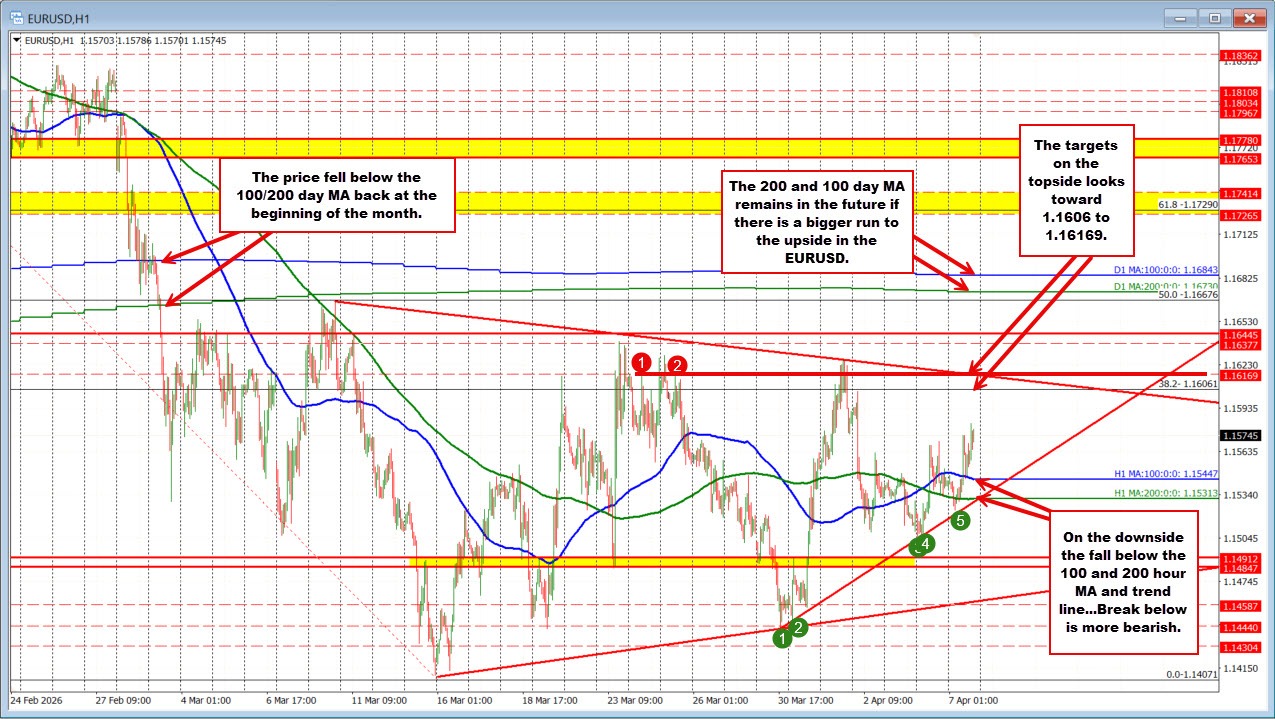
From a technical perspective, that bounce helps define the risk on the downside. The 100-hour moving average remains the first key support level, followed by the 200-hour moving average and an upward sloping trendline near 1.15313. As long as the price stays above this cluster, buyers maintain control in the short term. A break below that zone would be needed to shift the bias back toward the sellers.
On the topside, the pair is now approaching the next key resistance targets. The first comes in at the 38.2% retracement of the move down from the February 10 high at 1.1606. Just above that sits a confluence of resistance near 1.16169, where a downward sloping trendline intersects with a prior swing level. This area is a critical barometer—if broken, it would signal that buyers are gaining further traction.
A move above that zone would open the door for a run toward the March 23 high near 1.1638, followed by another swing level at 1.16445. Beyond that, traders would target the 50% retracement at 1.1667, with a key cluster of longer-term resistance defined by the 100- and 200-day moving averages between 1.1673 and 1.1684.
For now, the story is clear: buyers are in control above the moving average support, with momentum building toward key resistance levels overhead. The next move will depend on whether price can break through those resistance zones or rotate back lower toward support.
Key technical levels
Upside targets:
- 1.1606 – 38.2% retracement
- 1.16169 – trendline + swing level (key resistance)
- 1.1638 – March 23 high
- 1.16445 – swing level
- 1.1667 – 50% retracement
- 1.1673 – 1.1684 – 100 & 200 day MAs
Downside support:
- 1.15447 – 100-hour MA (near-term pivot)
- 1.15313 – 200-hour MA + trendline (key support zone)
- 1.1484 to 1.1491 swing area-


