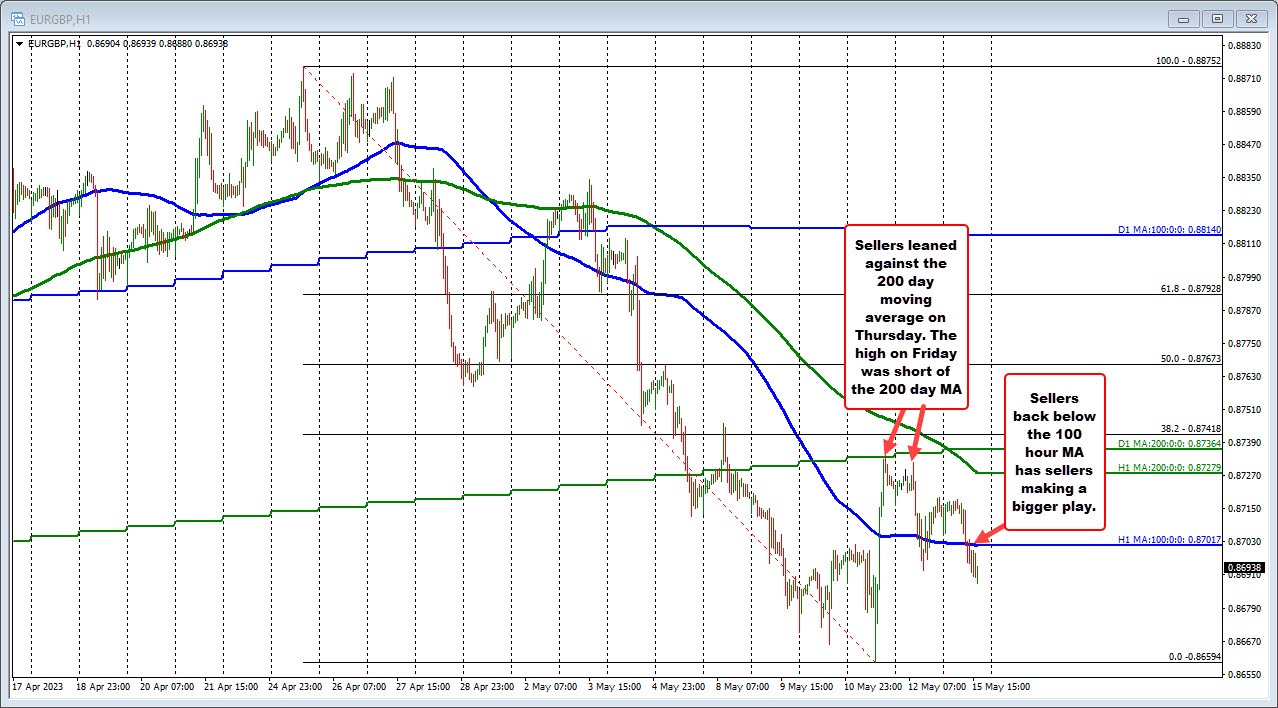
The EURGBP trended downwards last week, but it experienced a surge of buyers on Thursday, reversing its declining trajectory. From a technical perspective, this upturn that started at Thursday's low of 0.8659 brought the pair beyond its descending 100-hour moving average, but it halted at the 200-day moving average, which was at 0.8734 at the time.
Investors, taking their cue from this level, caused the price to dip back below the 100-hour moving average on Friday. However, a rebound in the US session brought the closing price back above this moving average level. In today's European session, the pair has once again slipped below the 100-hour moving average, which currently sits at 0.87017 (refer to the blue line in the chart).
From a technical standpoint, if the pair maintains a position below this level, it could signal a firm grip by sellers, likely shifting traders' focus towards last week's lows. On the flip side, if the pair climbs above the 100-hour moving average and then surpasses the descending 200-hour moving average at 0.87279, followed by the 200-day moving average currently at 0.87364, these breakouts would be necessary to boost the bullish bias.
Also, note that the 38.2% retracement level at 0.87418 serves as another key target that buyers would need to reach and surpass to assert more control over the market.


