The tensions in the Middle East have risen on late Tuesday as a rocket hit a hospital in Gaza killing hundreds of people and sparking a global outrage. As a consequence, Jordan cancelled the summit that was scheduled between the US President Biden, the Palestinian President Abbas and the Egyptian President al-Sisi in Amman.
On a domestic side, the strong US Retail Sales data was followed by a rally in Treasury yields with the 10yr approaching 5.00%. This tightening in financial conditions might be weighing on the stock market, especially in this part of the cycle when the past rate hikes should start to feed through the economy faster.
Dow Jones Technical Analysis – Daily Timeframe
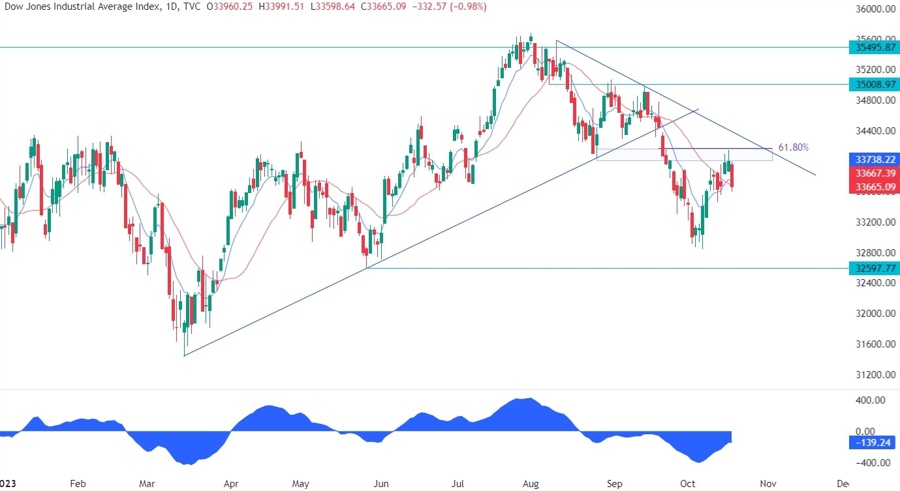
On the daily chart, we can see that the Dow Jones eventually reached the key resistance zone around the 34000 level where we had the confluence with the previous swing low level and the 61.8% Fibonacci retracement level. The sellers piled in with a defined risk above the resistance to position for a drop back into the lows. The buyers, on the other hand, will need the price to break above the trendline to invalidate the bearish setup and start targeting the cycle highs.
Dow Jones Technical Analysis – 4 hour Timeframe
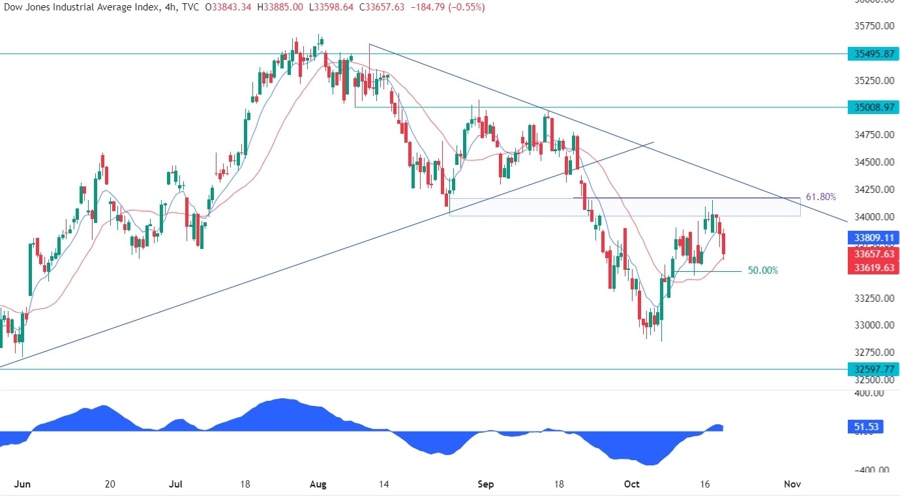
On the 4 hour chart, we can see that we have a good support level around the most recent swing low at 33500 where we can also find the confluence with the 50% Fibonacci retracement level and the red 21 moving average. This is where the buyers are likely to step in with a defined risk below the level to target the trendline and eventually a breakout.
Dow Jones Technical Analysis – 1 hour Timeframe
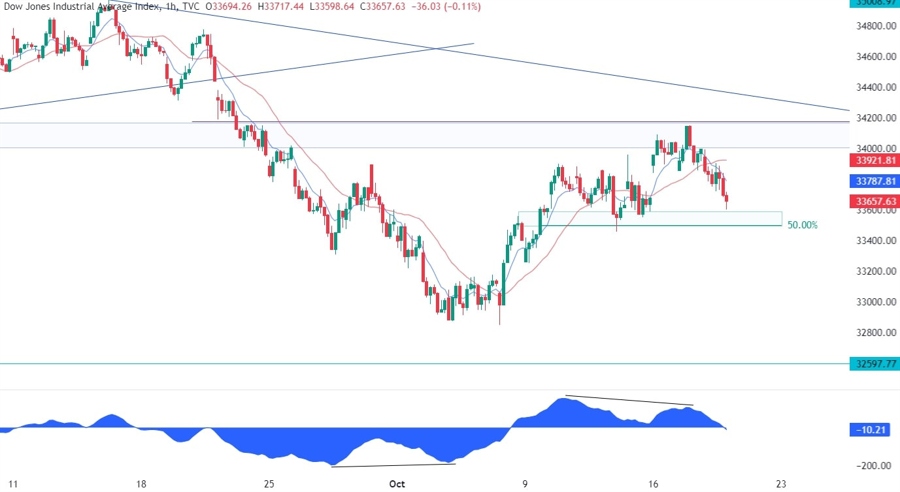
On the 1 hour chart, we can see that we had a divergence with the MACD right into the key resistance. This is generally a sign of weakening momentum often followed by pullbacks or reversals. In this case, as long as the price stays above the support zone around the 33500 level, we will be in the pullback territory. On the other hand, if the price breaks through the support zone, we will have a confirmation of a reversal and the sellers will pile in even more aggressively to target the 32597 level.
Upcoming Events
Today we will get the latest US Jobless Claims data and it will be interesting to see if the miss in Continuing Claims last week was just a blip or the start of a trend. Later in the day we will also hear from Fed Chair Powell where the market will be focused on any hint about the near-term policy outlook.
See the video below
