Last week the US data surprised to the upside with the ISM Services PMI and Jobless Claims beating expectations by a big margin. The market didn't like the strong data as it raises the chances of another rate hike in November. In fact, the Dow Jones sold off following the PMI beat with some consolidation thereafter, even after the strong Jobless Claims. The market seems to be trading on “good news is bad news” at the moment, but the outlook remains uncertain.
Dow Jones Technical Analysis – Daily Timeframe
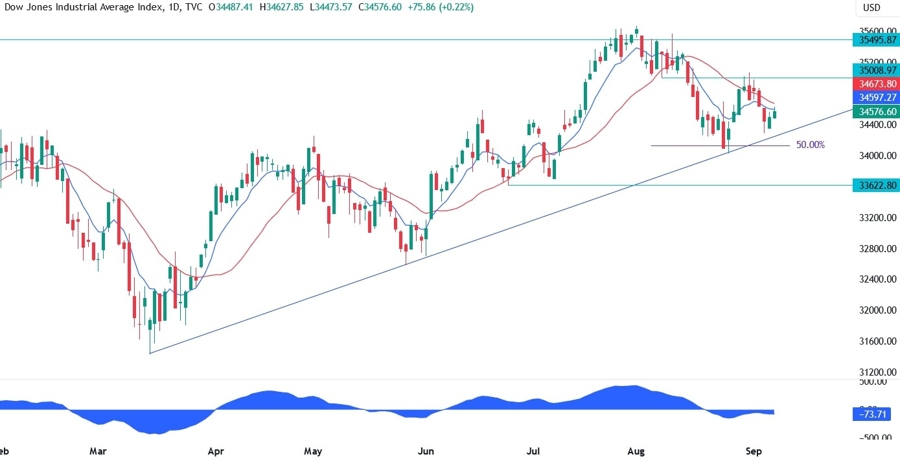
On the daily chart, we can see that the Dow Jones recently sold off from the 35000 resistance but bounced back near the upward trendline. The major trend remains bullish, but the near term bias is bearish as the moving averages are crossed to the downside. A break above the 35000 resistance will switch the bias from bearish to bullish and should lead to more buyers coming into the market taking the price to a new high.
Dow Jones Technical Analysis – 4 hour Timeframe
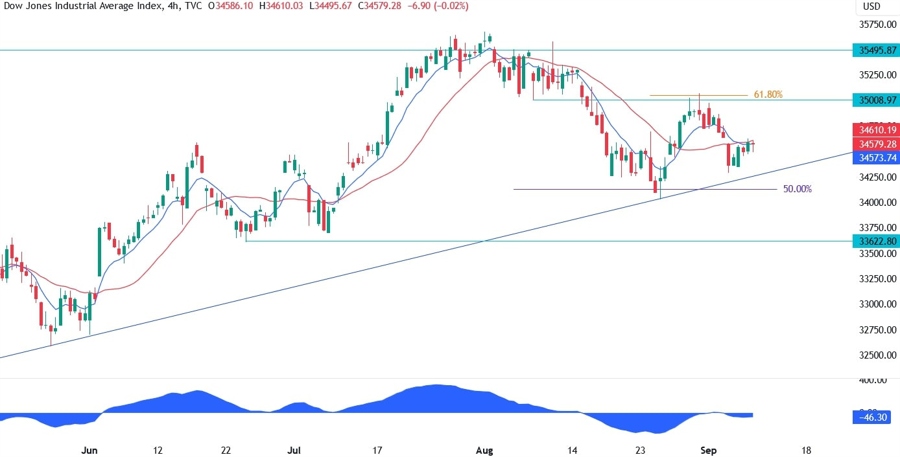
On the 4 hour chart, we can see that at the moment we have some consolidation near the trendline as the economic data sends mixed signals. The selloff from the resistance led to a moving averages crossover and we might see the sellers leaning on the red 21 moving average here to position for a break below the trendline.
Dow Jones Technical Analysis – 1 hour Timeframe
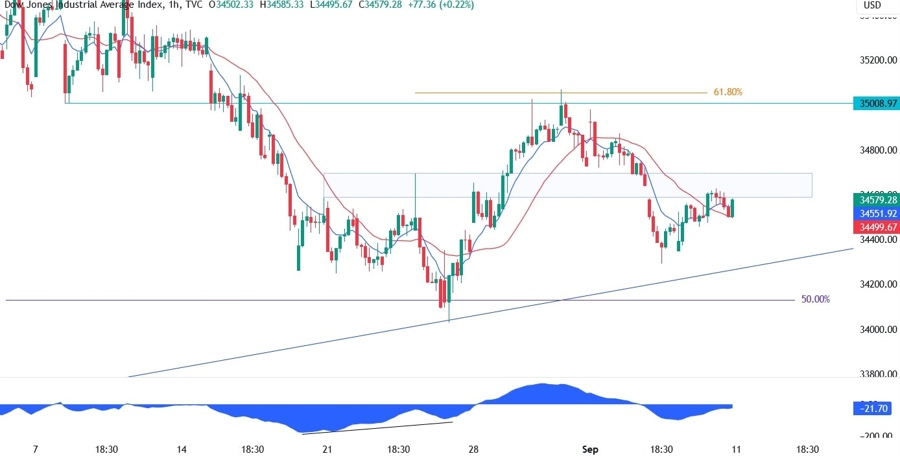
On the 1 hour chart, we can see more closely the resistance zone around the 34650 level. This is acting as kind of a barometer for the sentiment with the bias being more bullish above the level and bearish below the level. In fact, we can expect the buyers to pile in if the price breaks to the upside and position for a rally into the 35000 resistance and beyond. The sellers, on the other hand, are likely to step in here with a defined risk above the resistance and target a breakout of the trendline and new lower lows.
Upcoming Events
This week is likely to be a volatile one given the release of top tier economic indicators including the US CPI. In fact, on Wednesday we get the US CPI report, which is expected to show an acceleration in the headline inflation but a deceleration in the core measure. On Thursday, we get the US PPI, Retail Sales and Jobless Claims data. Finally, we conclude the week with the University of Michigan Consumer Sentiment report on Friday.
