Dow Jones Technical Analysis Video
My technical analysis video comes before the quick FOMC review for some of the readers that may be interesting in that. Those that have already seen my videos on investingLive.com may know that I like to try to keep the charts real simple, yet effective. This means that I do not bombard my TradingView with 12 indicators and too many bells and whistles. So here it is on the 1hr timeframe, and a key bull flag that will be an important technical element in our "map":
In this video, I break down the Dow Jones technical setup on the hourly chart following last night’s FOMC meeting. The Dow is currently sitting near yesterday’s close, and traders are wondering what comes next.
I walk through a bull flag pattern, explain how the breakout happened during the FOMC reaction, and show how price made a clean retest of the upper trendline and the anchored VWAP from December 9. I also highlight a key level around 47,875, which may signal weakening bullish momentum if price falls below it for more than a couple of hourly candles.
This video gives a clear, noise free look at the Dow using the hourly timeframe and helps you understand where the market may go next — while reminding you that post-FOMC volatility can continue. Watch the full analysis and follow the key levels and scenarios to guide your own decision making
Dow Jones Technical Analysis on the Weekly Timeframe
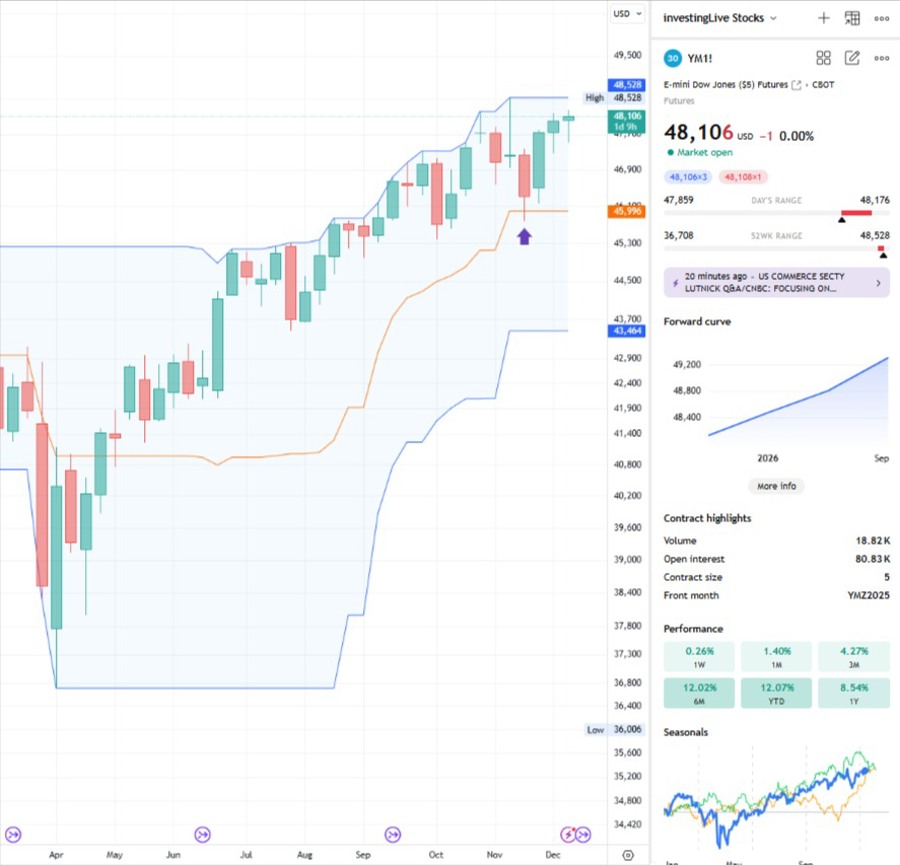
A Donchian Channel is a technical indicator that plots the highest high and lowest low over a chosen period, along with a Basis line (orang line in my weekly timeframe chart above of Dow Jones futures), which is simply the midpoint between those two extremes. Traders use the upper band to spot potential breakouts or bullish momentum, the lower band to identify possible breakdowns or bearish pressure, and the Basis to gauge the “average” location of price within the channel. When price stays above the Basis, it often signals stronger upward bias; when below, it can reflect weakening momentum. This makes the Donchian Channel a simple but useful tool for tracking volatility, trend direction, and key support or resistance areas.
My chart shows that Dow futures pulled back to the basis (45,996) of the weekly Donchian channel, a level that often acts as dynamic support. The structure now looks constructive, and in my view it may want to make another attempt at the all time high (48,528). Traders should still stay alert to the possibility of a lower double top if buyers fail to hold momentum near resistance.
So After We Dove into the Dow Jones Technical Analysis, What Happened at the FOMC Yesterday?
The Federal Reserve (the Fed) met yesterday and made two important decisions:
1. They cut interest rates again
This is the third time in a row they lowered rates.
Lower interest rates make borrowing cheaper for homes, cars, businesses and credit cards. Lower rates also tend to help the stock market over time, because companies face lower costs.
2. They hinted they might be done cutting for now
This means the Fed wants to wait and see how the economy reacts before lowering rates again.
3. Powell said the job market is cooling “gradually”
This means, Powell is signaling that people are still getting jobs, companies are still hiring.
But things are slowing down a little. Not crashing, just cooling gently.
A cooling job market reduces inflation pressure, which is what the Fed wants
What This Means for the Dow Jones
The Dow Jones is a collection of 30 large, well known American companies.
People often look at it as a general indicator of how the stock market feels.
Short term (today, this week):
The Dow Jones futures are currently hovering near yesterday’s close.
This means the market is thinking, not panicking or celebrating.
Why?
Because:
The Fed cut rates (positive)
But may pause now (neutral)
The economy is cooling slightly (mixed but not scary)
So the market is steady, waiting for more information.
Medium to longer term, lower rates tend to be bullish for Dow Jones
Lower rates usually tends to support the Dow Jones, even if the short term moves are small.
So, the Fed cut rates again, the economy is cooling gently, and the Dow is calm because the news is good but not explosive. The FOMC meeting has also helped the USD go lower. And even if it not included in the Dow Jones, Oracle's significant 10% drop post earnings might not help the indices today, and overall market sentiment, either. It will be interesting to see how Oracle stock price reacts at the US market open.
Who cares about the Dow Jones technicals?
Many people who know me from different trading and investing groups know that I often emphasize one of the biggest advantages of technical analysis when it’s done properly. It doesn’t replace fundamentals, and it doesn’t contradict them. They actually work together, like yin and yang. But fundamentals rely on assumptions that can shift over time and are open to opininons. For example, what counts as “overvalued” changes. There were periods when a P/E of 15 was normal, and others when 25X was considered acceptable. And of course, there is always the problem of not knowing what we don’t know. Technicals, on the other hand, give us objective signals. We may not always understand why a price breaks below a key level, but if it does and it sustains there, we know it happened. That lets us react immediately instead of guessing.
This Dow Jones video analysis offers exactly that kind of objective map. It gives you a clean hourly view with near term guidelines and key levels that show where the bullish premise remains valid and where it fails. If price slides back down and holds inside the channel highlighted in the video, then the previously broken bull flag is no longer valid. We also show an anchored perspective that’s worth watching. Use these levels as a practical map to guide your decisions, at your discretion.
