Last Friday, the NFP report beat expectations across the board with the unemployment rate falling to 3.7% vs. 3.9% previously and the average hourly earnings on a monthly basis higher than expected at 0.4%. The jobs data was followed by a strong University of Michigan Consumer Sentiment survey where inflation expectations fell much more than expected.
Overall, it was a good day for those in the soft-landing camp, but it also raised the risk of a hawkish FOMC rate decision on Wednesday as the Fed might push against rate cuts expectations more strongly. The Dow Jones continues to consolidate at the highs as there might not be that much of an incentive to keep pushing ahead of this week's risk events.
Dow Jones Technical Analysis – Daily Timeframe
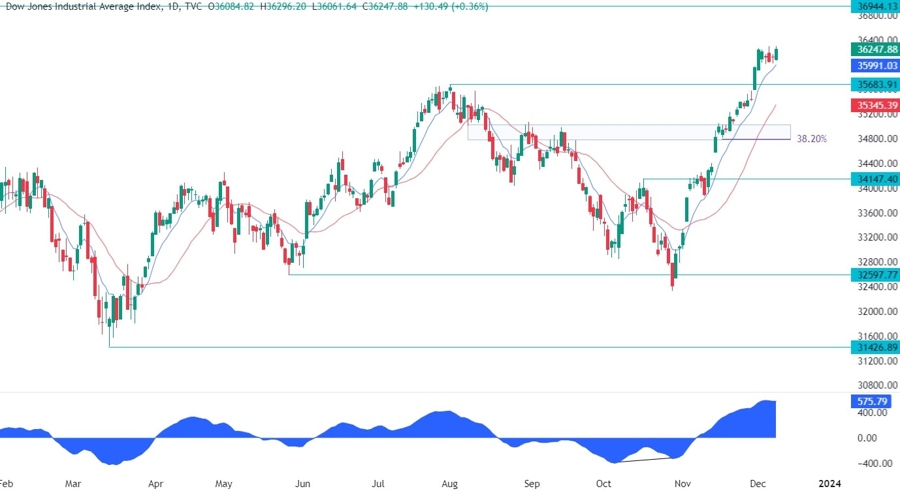
On the daily chart, we can see that the Dow Jones continues to consolidate at cycle highs as the market probably awaits this week’s major events. From a risk management perspective, the buyers would be better off to wait for a pullback into the previous cycle high at 35683 where they will also likely find the red 21 moving average for confluence. The sellers, on the other hand, will want to see the price breaking below the 35683 level to position for a drop into the next support zone around the 35000 level.
Dow Jones Technical Analysis – 4 hour Timeframe
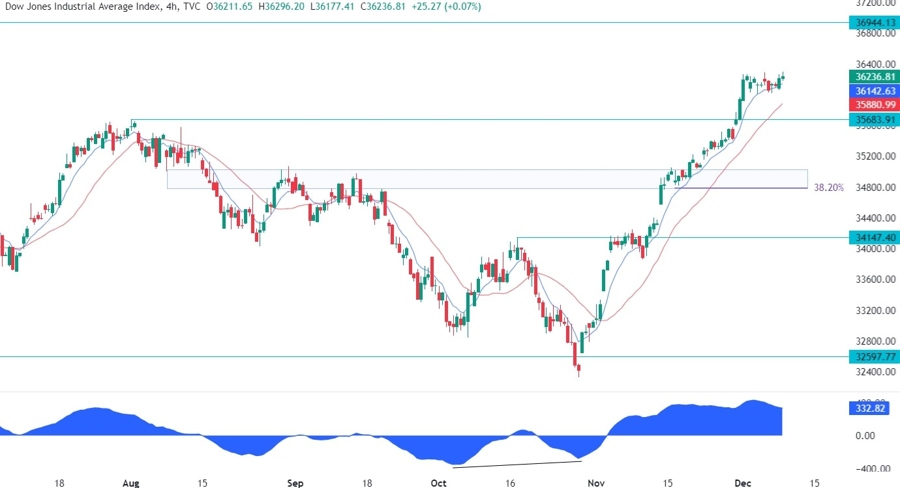
On the 4 hour chart, we can see that the Dow Jones is just a couple of percentage points from the all-time high, which looks insane after everything that has happened in the past couple of years. Buying right now though, doesn’t make much sense considering the risk events in the next few days and no strong support level to lean on, so the buyers should wait at least for a pullback into the 35683 level. If we get an extension into the all-time high, the sellers will likely step in with a defined risk above it to target a drop into the 35683 level.
Dow Jones Technical Analysis – 1 hour Timeframe
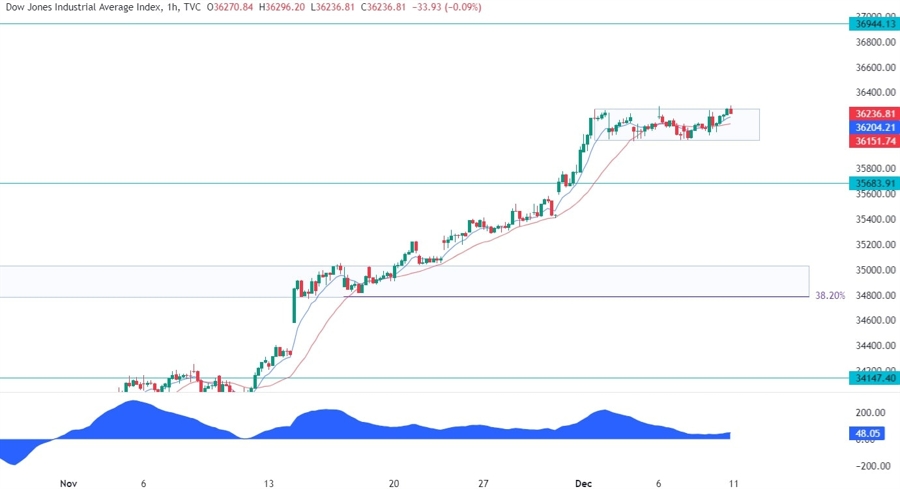
On the 1 hour chart, we can see that the price has been trading in a tight range in the past week and couldn’t break out of it even after the last Friday’s data. This gives us a clear playbook though as a break to the upside should see more buyers piling in and extending the rally into the all-time high, while a break to the downside should see the sellers stepping in to target the 35683 level first and upon a break lower, the 35000 support zone.
Upcoming Events
This week is going to be a big one with the US CPI and the FOMC rate decision on the agenda. We begin tomorrow with the release of the US CPI report where the market will want to see how the disinflationary trend is going. On Wednesday, we have the US PPI data followed by the FOMC rate decision where the Fed is expected to keep interest rates unchanged. On Thursday, we will see the US Retail Sales and Jobless Claims figures, while on Friday we conclude the week with the US PMIs.
