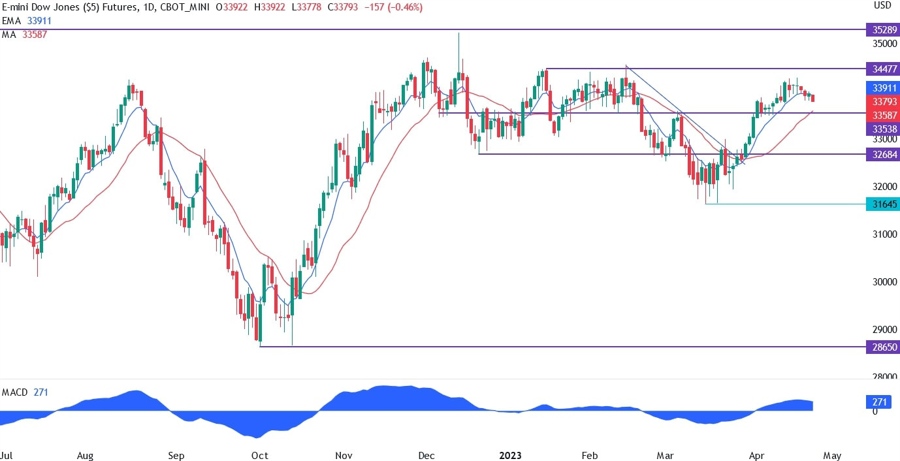
On the daily chart below for the Dow Jones, we can see that the price keeps pulling back from the 34285 high reached before the US Retail Sales missed expectations across the board. The sellers are targeting the support at 33538 and the red long period moving average.
That’s the spot where we are likely to find the buyers and the price to bounce. Last Friday, the market extended the fall as the US PMIs beat expectations and the details about inflation were not encouraging.
Dow Jones Technical Analysis
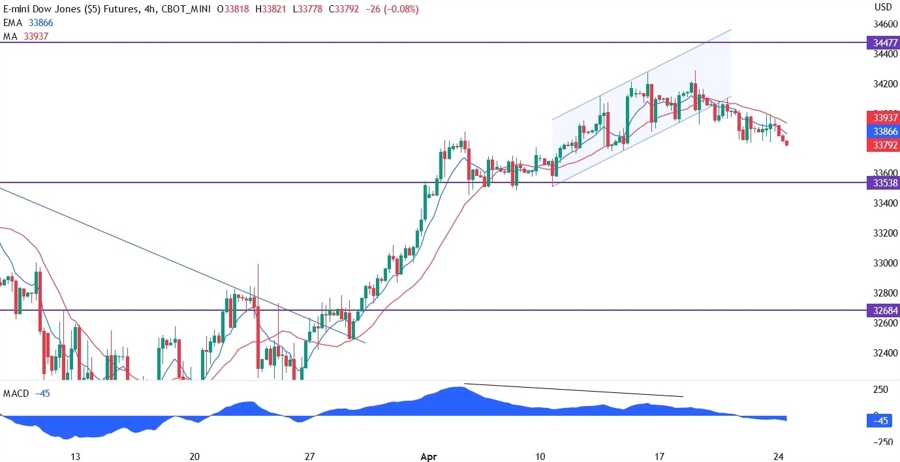
On the 4 hour chart below, we can see that the price was trading within a rising channel and it was also diverging with the MACD, which is generally a signal of a weakening momentum. The price has recently broken out of the channel turning around the short-term trend.
The sellers are now in control and the moving averages are acting as resistance for this correction. The natural target is the 33538 support where the price will also find the daily red long period moving average.
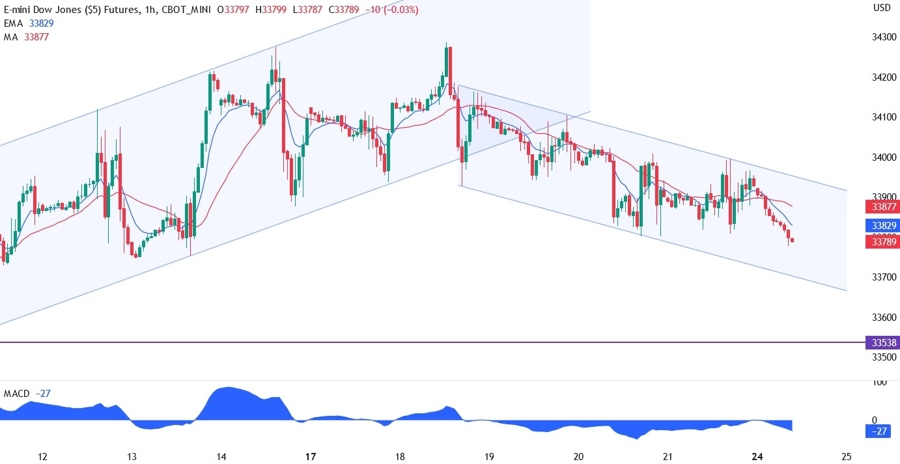
In the 1 hour chart below, we can see that after breaking out of the bullish channel, the price is now trading within a bearish one. At the moment, the price is trading roughly in the middle of the channel, so there’s really nothing to do here.
If the price pulls back to the top of the channel, we should see the sellers piling in again targeting the bottom of the channel and eventually the 33538 support. The buyers, on the other hand, may lean on the bottom of the channel to target the upper bound and eventually a breakout.