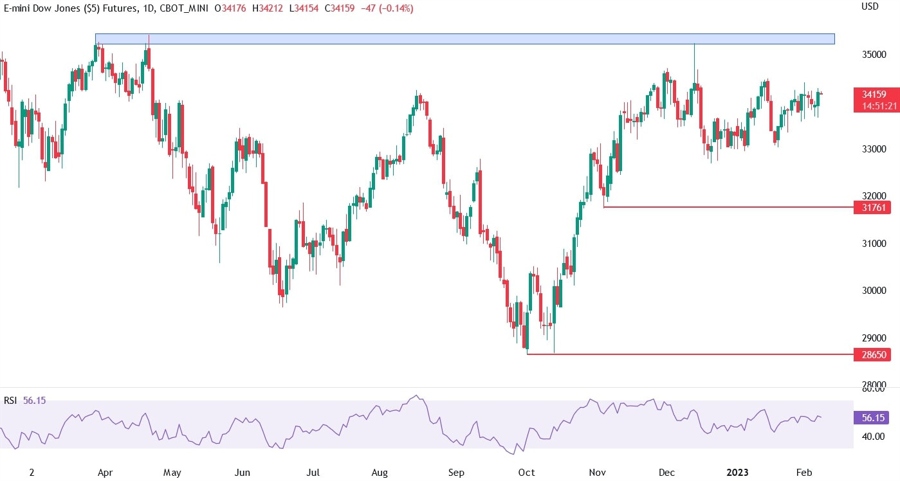
On the daily chart below, we can see that the price has started to range again. We first saw this behaviour during Christmas holidays. Then after a breakout to the upside, the price made a bullish run before getting smacked down again by a big miss in retail sales data.
The bulls then tried to make a run again but this time lacked conviction as fears of “good news is bad news” returned. After a blockbuster NFP report and a big beat in ISM Services PMI, the market has been rethinking about the Fed’s terminal rate and recently we heard from Fed members that this may really be the case.
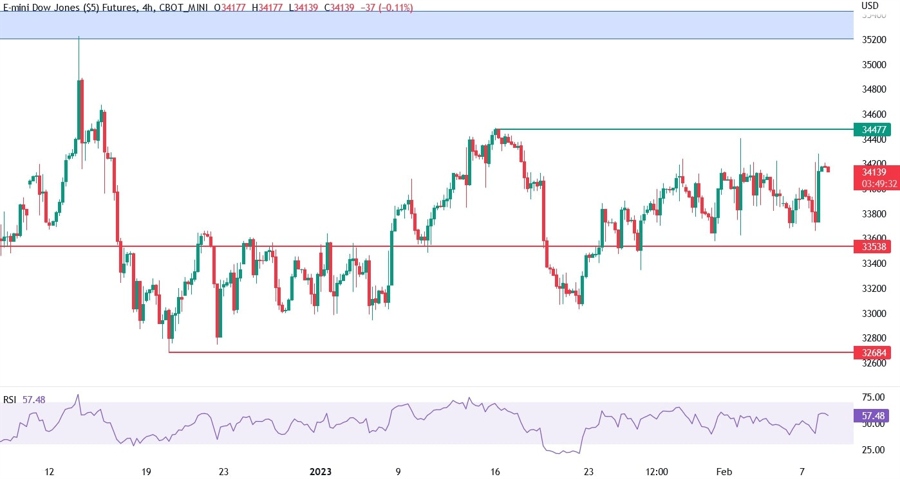
On the 4 hour chart below, we can see more clearly the ranging price action. These types of markets are the trickiest to trade. The bulls will need a clear break of the 34477 resistance to target the next resistance at 35200. The bears, on the other hand, will need to break below the 33538 support to target the next support at 32684.
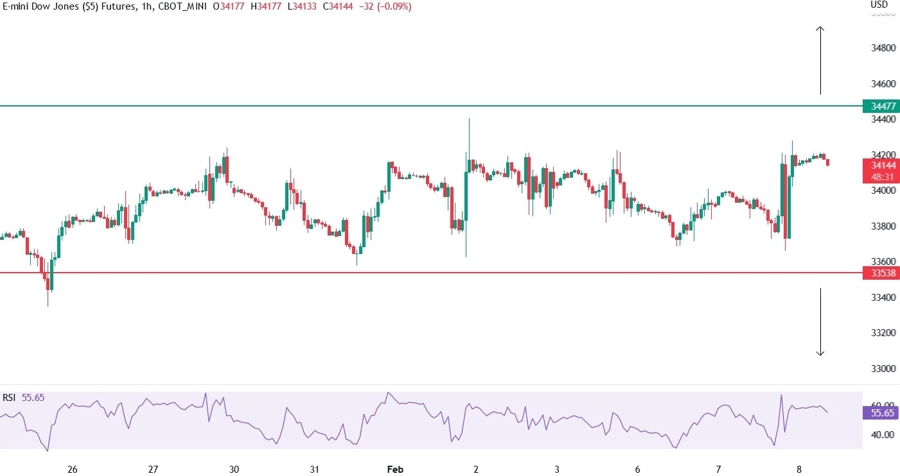
In the 1-hour chart below, we can see the two possible scenarios. One can also “play the range” selling at resistance and buying at support as long as the range holds. There are no market moving economic data today, so the technicals should lead. The possible risk event will be tomorrow when we will get the US Jobless Claims data. Fed Chair Powell yesterday said that beats in inflation or labour market reports would make a higher terminal rate more likely.