Fundamental Overview
Crude oil dropped on Friday following the soft US NFP report as some worries about a slowdown in growth weighed on the market. Overall, the data wasn’t as bad as one might think by just looking at the reaction but given that we were positioned for a strong report, the positioning got unwound quickly.
This weekend we had also the OPEC+ meeting where the group agreed to raise oil production by 547,000 barrels per day for September as expected. This move completed the unwinding of the voluntary output cuts from 2023. The market priced this in months ago and therefore the reaction is now negligible.
The focus is now on economic data and the Fed as that’s what is going to influence growth expectations in the months ahead. The tariffs trade is now over as pretty much everything is priced in and everyone knows we’ll settle within the 10-20% tariff range.
The growth and inflation picture should remain skewed to the upside for now as the Fed forward guidance remains tilted towards easing. That should keep the market supported but overall, we should remain rangebound within the $60 and 80$ price area.
Crude Oil Technical Analysis – Daily Timeframe
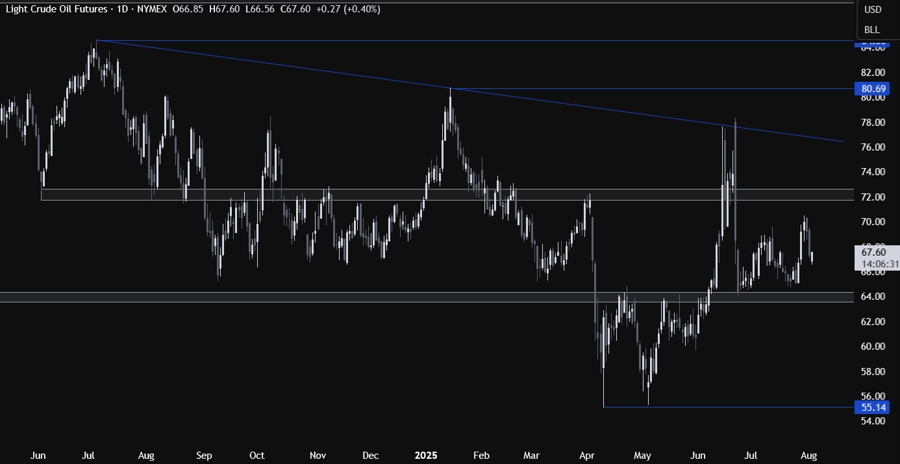
On the daily chart, we can see that crude oil continues to range between the key 64.00 support zone and the 72.00 resistance. The buyers will likely keep on stepping in around the support with a defined risk below it to target a move back into the 72.00 resistance. The sellers, on the other hand, will need a break below the support to open the door for a drop into the 55.00 handle next.
Crude Oil Technical Analysis – 4 hour Timeframe
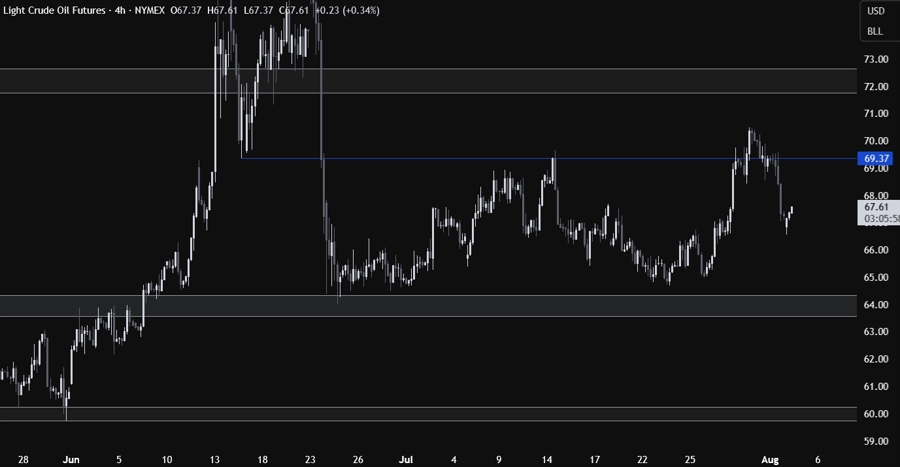
On the 4 hour chart, we can see that we probed above a minor resistance around the 69.00 level, but we couldn’t sustain the breakout and fell below the level pretty quickly before selling off after the soft NFP release. There are no clear levels where to lean onto, so from a risk management perspective, the buyers will want to pile in around the support, while the sellers will keep on stepping in around the resistances.
Crude Oil Technical Analysis – 1 hour Timeframe
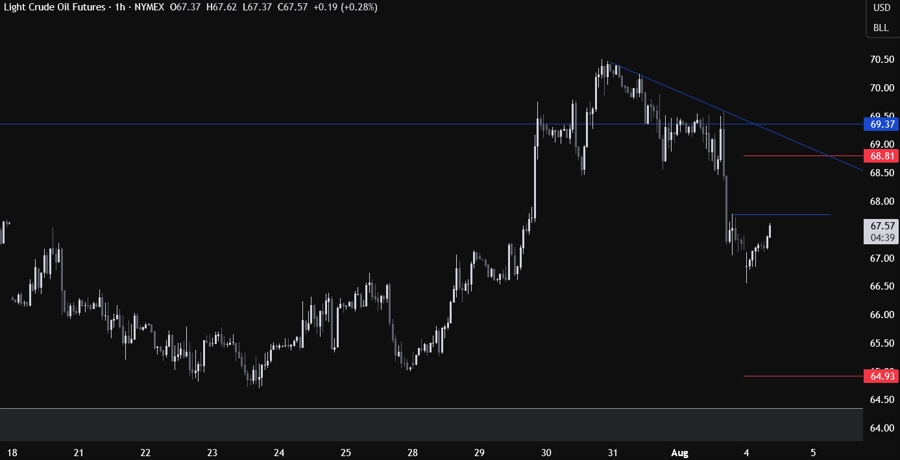
On the 1 hour chart, we can see that we have the most recent swing high level at 67.80 that could act as resistance. We can expect the sellers to step in around these levels with a defined risk above the swing point to position for a drop into the support. The buyers, on the other hand, will look for a break higher to increase the bullish bets into the 69.00 resistance next. The red lines define the average daily range for today.
Upcoming Catalysts
Tomorrow we have the US ISM Services PMI and on Thursday, we get the latest US Jobless Claims figures.
