Fundamental Overview
Crude oil looked set for a rally into the 70.00 level last week after some key technical breakouts but eventually dropped all the way back to the most recent low around the 61.45 level. The catalysts were the Reuters report saying that OPEC+ was set to hike output at the Sunday’s meeting again, and then the soft US data that threw in some economic slowdown fears.
The market positioned bearish into the weekend in a classic “buy the rumour” move. Over the weekend, OPEC+ hiked output by 137K bpd per month and said that adding the remainder of the 1.66 million barrels of cuts will be contingent on “evolving market conditions” and increases could even be reversed.
That helped the market as oil prices bounced back on the more cautious OPEC+ guidance and the “sell the fact” trade. Moreover, there are some fears that new sanctions on Russia could lift prices further, although in the bigger picture sanctions generally have limited impact on prices due to shadow markets and market flexibility. In the short-term though, they could give prices a boost. Fed rate cuts could also help spurring growth and switch the market focus towards higher future demand.
Crude Oil Technical Analysis – Daily Timeframe
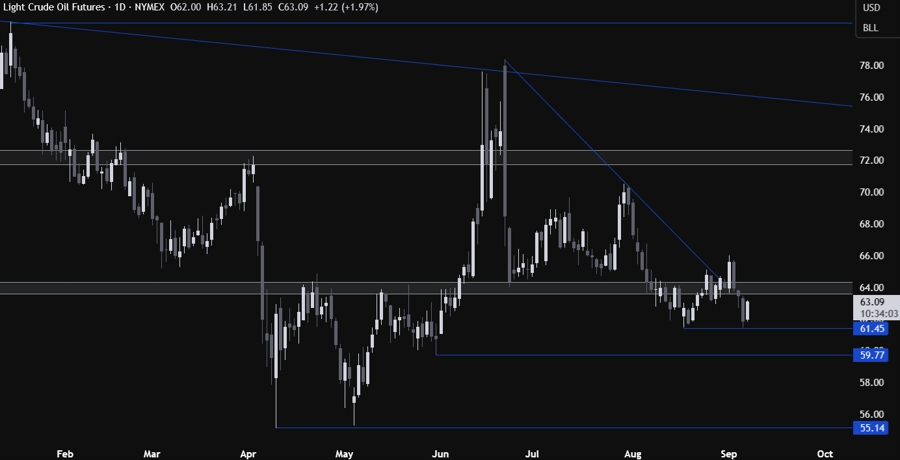
On the daily chart, we can see that crude oil looked like it was breaking out last week with the price probing above the trendline and the 64.00 zone, but eventually it turned out to be a fakeout following the reports of potential OPEC+ output hike and then the weaker US data. The price dropped all the way back to the most recent low at 61.45 where it bounced as the market “bought the fact” on the OPEC+ hike.
Crude Oil Technical Analysis – 4 hour Timeframe
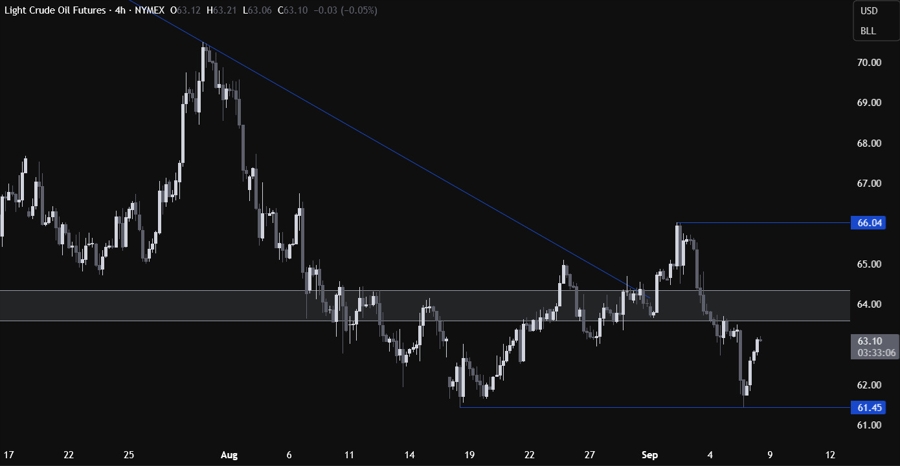
On the 4 hour chart, we can see that the price is now approaching the key 64.00 zone again. This is where we can expect the sellers to step in with a defined risk above the zone to position for a drop into new lows. The buyers, on the other hand, will look for a break higher to increase the bullish bets into the 66.00 handle next.
Crude Oil Technical Analysis – 1 hour Timeframe
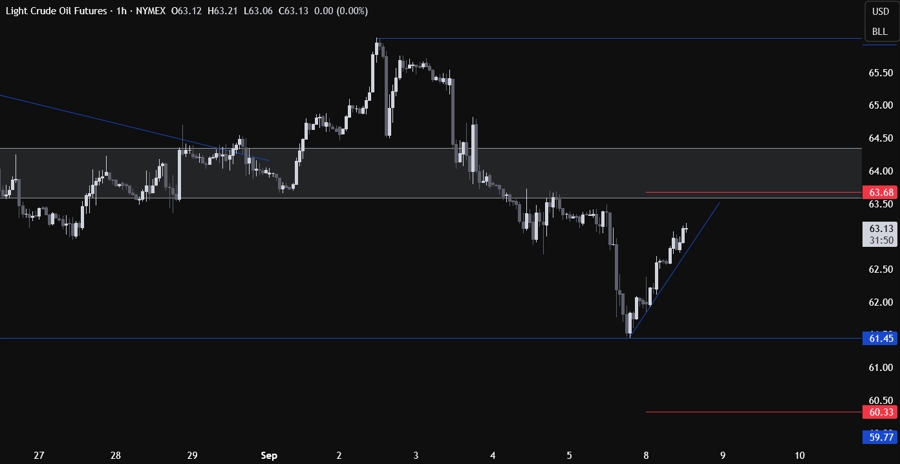
On the 1 hour chart, we can see that we have a minor upward trendline defining the bullish momentum on this timeframe. The buyers will likely continue to lean on the trendline with a defined risk below it to keep pushing into new highs, while the sellers will look for a break lower to pile in for a drop into the 61.45 low. The break might also just provide a pullback for the buyers to enter at better prices and not necessarily lead to new lows. The red lines define the average daily range for today.
Upcoming Catalysts
On Wednesday we have the US PPI report. On Thursday, we get the US CPI report and the latest US Jobless Claims figures. On Friday, we conclude the week with the University of Michigan Consumer Sentiment report.
