Copper rallied on Monday after the Chinese consumer and producer price inflation showed some improvement in the world’s largest Copper importer. Chinese authorities keep on rolling out support for the economy to spur growth with the PBoC expected to proceed with more rate cuts on key benchmarks. The future outlook for global growth remains downbeat as we are starting to see the aggressive monetary tightening measures adopted by the central banks filtering through the economies and weighing on growth. Overall, the picture is mixed but skewed to the downside.
Copper Technical Analysis – Daily Timeframe
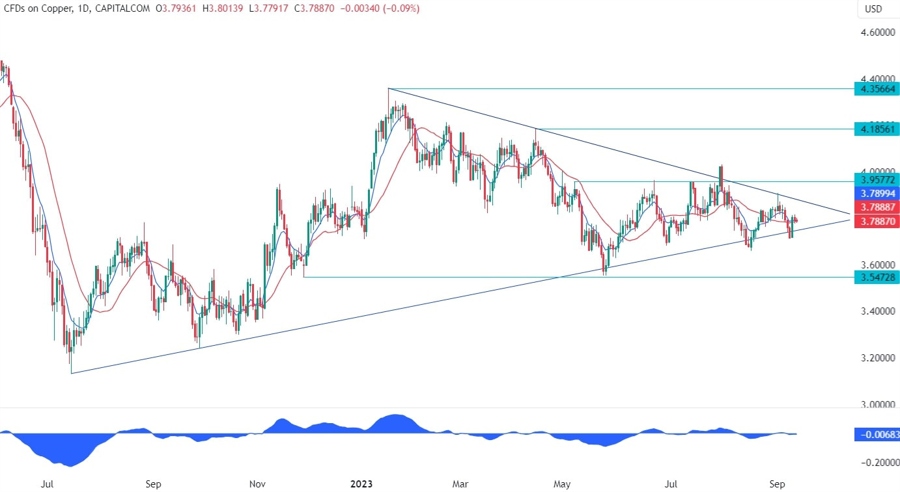
On the daily chart, we can see that Copper reached the upper bound of the triangle pattern and then sold off into the lower bound where it bounced. The price just keeps on ping ponging between the triangle boundaries, but the swings are getting tighter and tighter and eventually we will get a breakout. Be ready for it as we should get a strong and sustained move after the breakout.
Copper Technical Analysis – 4 hour Timeframe
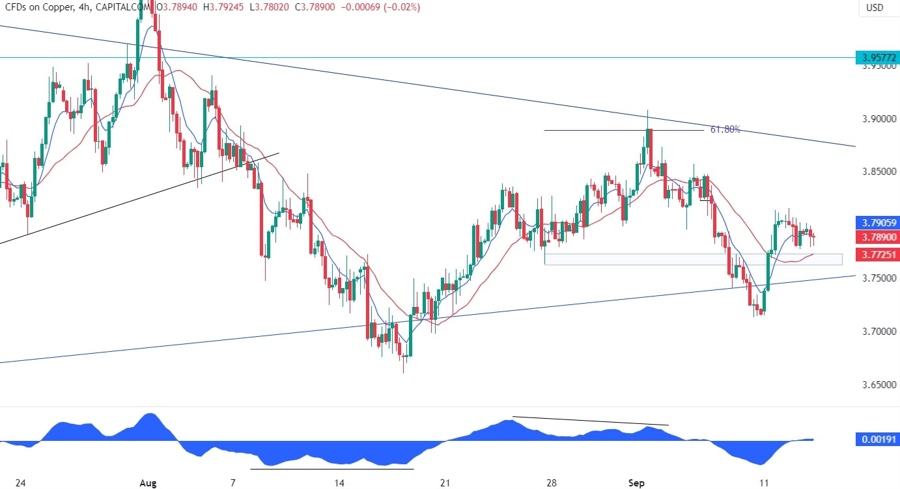
On the 4 hour chart, we can see that the price bounced around the lower bound of the triangle and rallied into a new higher high making the moving averages to cross to the upside and turning the bearish short term trend into a bullish one. We should now see the buyers piling in around the support at the 3.77 level and the red 21 moving average to position for a rally into the upper bound of the triangle. The sellers, on the other hand, would like to see the price breaking the triangle to the downside to position for a big selloff, but if that won’t be the case, they will still be leaning on the upper bound of the pattern to pile in and target the lower bound.
Copper Technical Analysis – 1 hour Timeframe
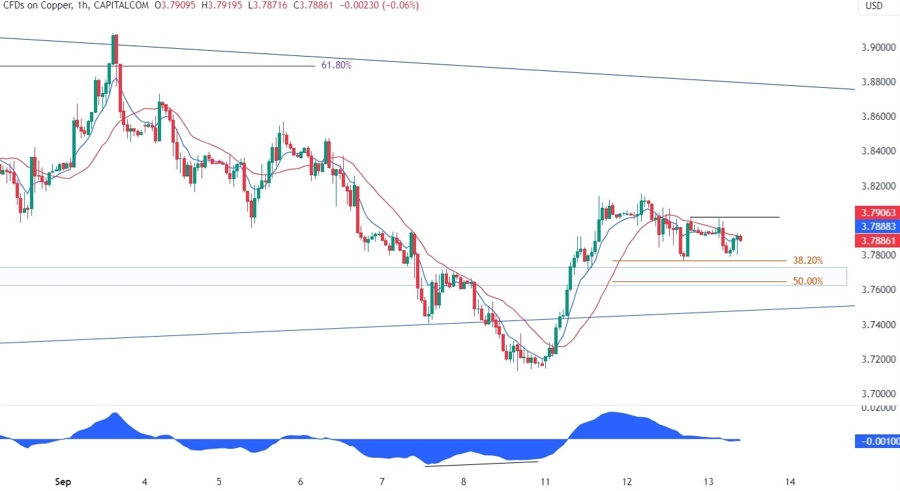
On the 1 hour chart, we can see that we had a divergence with the MACD right when the price was trading around the lower bound of the triangle. This is generally a sign of weakening momentum often followed by pullbacks or reversals. In this case, we got the reversal and now the buyers are again in control. We can see more clearly the support zone around the 3.77 level where we have also the confluence with the Fibonacci retracement levels. If the price breaks above the last swing high at 3.8015 then the buyers should have the confirmation of a continuation of the uptrend and pile in even more aggressively to target the upper bound of the triangle.
Upcoming Events
This week we have many important events. Today is the US CPI Day, which is expected to show an increase in headline inflation due to higher energy prices but further disinflation in the core measure. Tomorrow, we will see the latest US Jobless Claims, PPI and Retail Sales data. Finally on Friday, we get the Chinese Industrial Production and Retail Sales data followed later in the day by the University of Michigan Consumer Sentiment report. Copper might react more to growth related data like US Jobless Claims and Retail Sales, and the Chinese data. In fact, if we get bad readings, we should see a selloff in Copper, but if the data remains solid, then the bulls will remain in charge.
