Copper extended the rally into new highs despite some weaker US data lately. Overall, there are mixed signals with the PBoC Governor Pan recently signalling more monetary policy support to come on one hand, and the weakening US data on the other. The technicals have been more helpful lately in pointing to the right direction as key upside breakouts increased the bullish momentum.
Copper Technical Analysis – Daily Timeframe
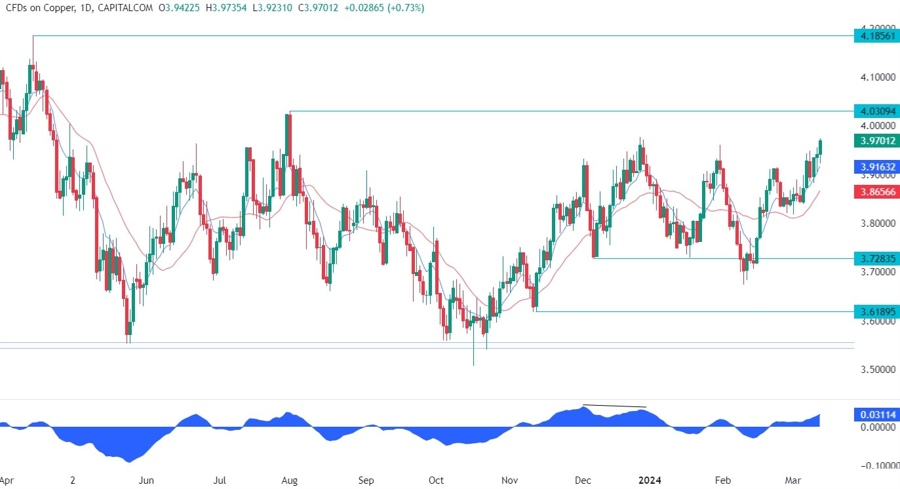
On the daily chart, we can see that Copper bounced on the red 21 moving average as the buyers started to pile in to position for a rally into the 4.03 level. The price is now at the recent highs and we can expect a pullback as the sellers will likely step in to position for a drop back into the lows.
Copper Technical Analysis – 4 hour Timeframe
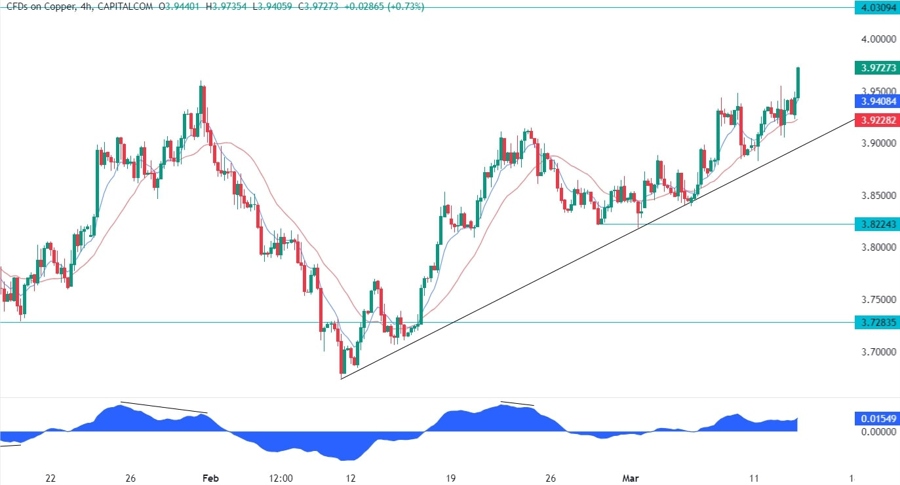
On the 4 hour chart, we can see that we now have a key upward trendline that is defining the current uptrend. In case we get a bigger pullback, this is where we can expect the buyers to step in with a defined risk below the trendline to position into the 4.03 level with a better risk to reward setup. The sellers, on the other hand, will want to see the price breaking lower to increase the bearish bets into the 3.82 level.
Copper Technical Analysis – 1 hour Timeframe
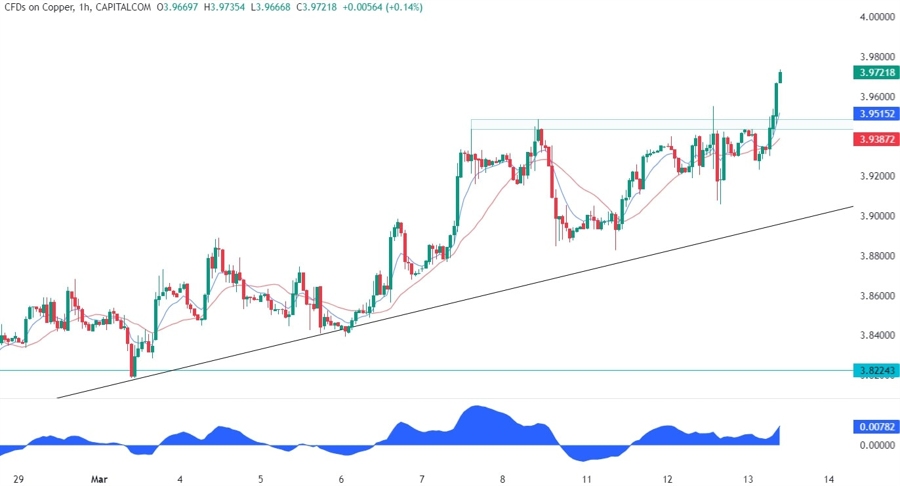
On the 1 hour chart, we can see that we have a resistance turned support around the 3.95 level. This is where the buyers will likely step in with a defined risk below the level to position for a rally into the 4.03 level. The sellers, on the other hand, will want to see the price breaking lower to target the major upward trendline and eventually a break below it.
Upcoming Events
Tomorrow we get the US PPI, the US Retail Sales and the US Jobless Claims figures. On Friday, we conclude the week with the University of Michigan Consumer Sentiment survey. Strong data is likely to support Copper, while weak figures should send the prices lower.
