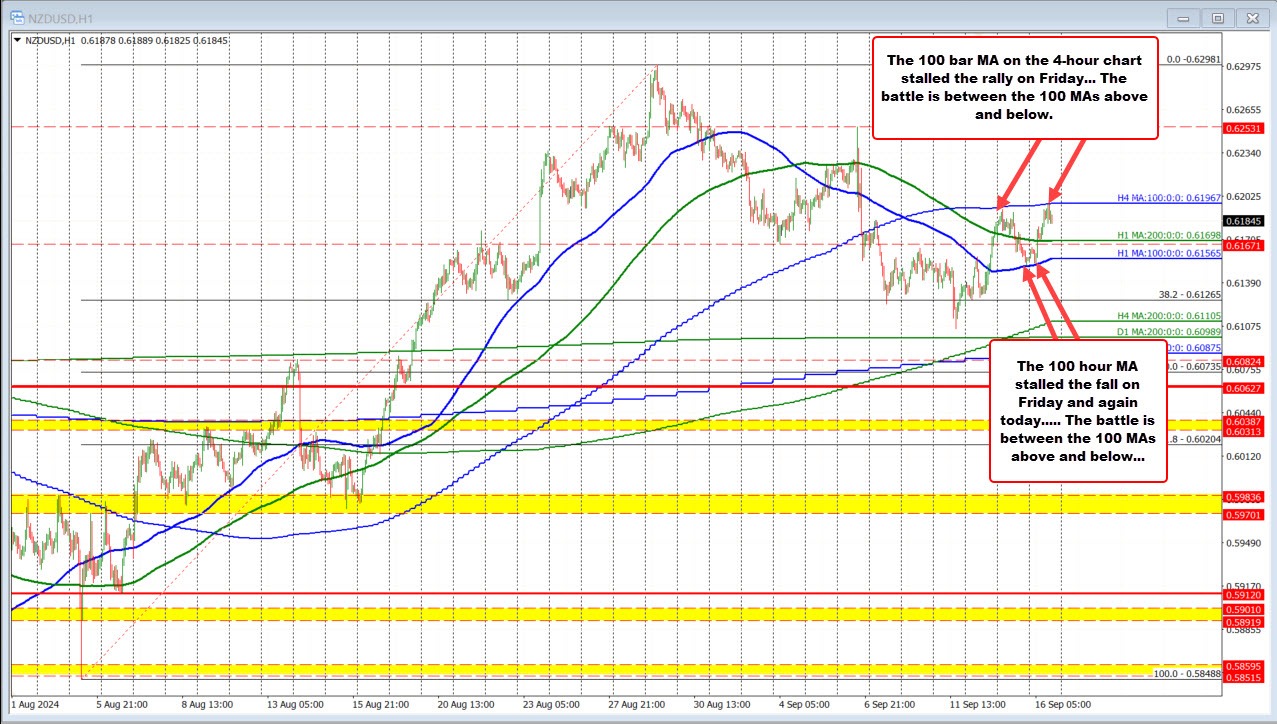
The last two trading days in the NZDUSD have developed a pattern. That pattern is to ping-pong between the 100-bar moving average on a 4-hour chart on the topside (currently at 0.61967), and the 100-hour moving average on the downside at 0.61565.
In between sits the 200-hour moving average at 0.61698.
Traders are leaning on support on the downside and resistance on the topside and waiting for the break with momentum.