Yesterday, the AUDUSD stretched above the July 2025 high (and high for the year) at 0.66247 reaching the highest level going back to November 2024. The high price reached 0.6635.
However, momentum could not be sustained, and the price corrected lower.
In my post yesterday I spoke to the potential disappointment, writing:
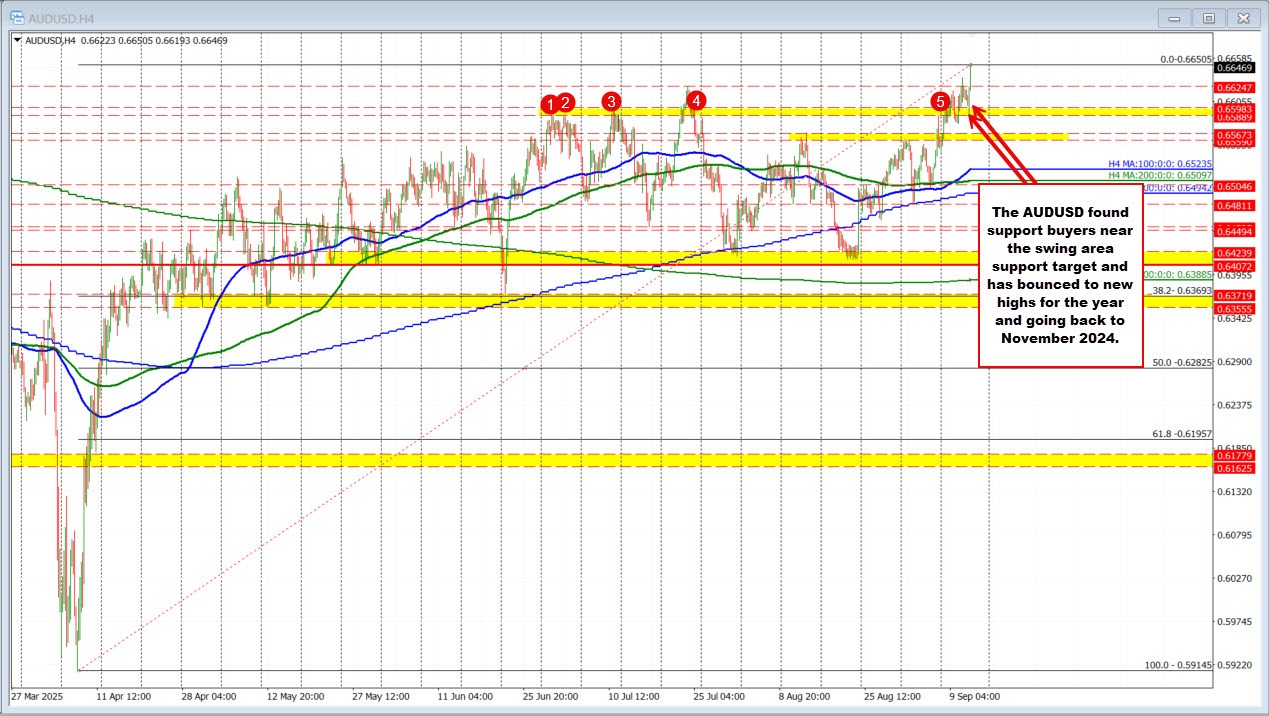
Drilling down to the 4-hour chart below, a move back below the July high could lead to some disappointment on the failed break in the short term. However, it would take a move back below 0.6588 to 0.6598 and then 0.6559 to 0.6567 to give the sellers more confidence (and give the buyers more concern). Absent that, and buyers will still hold onto more control, although less than if momentum can continue on the break higher today.
The “disappointment” from the failed break yesterday did indeed spill over into a rotation lower, with the pair falling to a low of 0.65894. That move tested the bottom of the initial swing area target at 0.6588–0.6598, a zone highlighted in yesterday’s analysis. There, buyers stepped in and leaned against support, halting the decline.
From that base, the market staged a recovery, which has since gathered momentum. The rebound has now carried the price back above the July high at 0.66247, and importantly, above yesterday’s peak at 0.6635.
The pair is currently pressing into fresh session highs near 0.66505, shifting the short-term bias back in favor of the buyers. Holding these gains keeps the bullish tone intact, with traders eyeing further topside extension if momentum continues.
What’s next for the pair?
The old July high at 0.66247 now shifts into play as the closest support level for traders. Holding above that mark would keep the door open for buyers and signal green lights for additional upside momentum. A move back below, however, would be more troubling—it could bring the market back toward the recent swing area, and after back-to-back failures, the risk of a decisive downside break would increase.
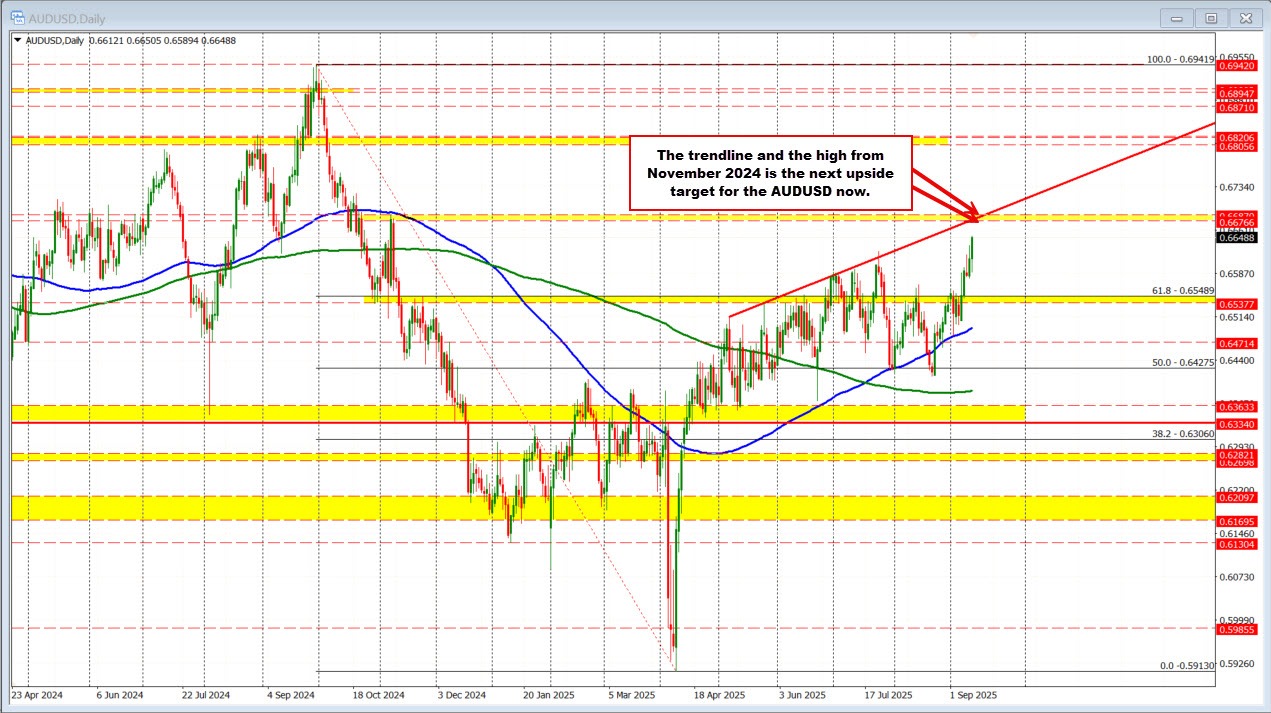
On the topside, the daily chart (see chart below) highlights new hurdles ahead. An upward-sloping trendline cuts across near 0.6676, setting the first test for continued bullish momentum. Just above that, the November 7 swing high at 0.6683 stands as a critical resistance level. A break through that zone would represent a meaningful win for buyers and strengthen the case for a broader bullish bias.