US:
- The Fed hiked by 25 bps as expected and kept everything unchanged at the last meeting.
- Fed Chair Powell reaffirmed their data dependency and kept all the options on the table.
- Inflation measures since then showed further disinflation.
- The labour market displayed signs of softening although it remains fairly solid.
- Overall, the economic data started to surprise to the downside lately.
- This week the ISM Services PMI and Jobless Claims surprised to the upside.
- The Fed members are leaning more towards a pause in September rather than another rate hike.
- The market doesn’t expect the Fed to hike at the September meeting, but there’s now a 50/50 chance of a hike in November.
Australia:
- The RBA kept its cash rate unchanged as widely expected as they are seeing signs that the economy is indeed slowing and that will help to return inflation back to target.
- The data is supporting the RBA’s stance as the Australian jobs, wages and inflation data all missed expectations lately.
- The Australian PMIs also missed expectations remaining in contraction.
- RBA Governor Lowe in his speech reaffirmed that if inflation remains sticky, they will have to tighten more.
- The market expects the RBA to hold rates steady at the next meeting as well.
AUDUSD Technical Analysis – Daily Timeframe
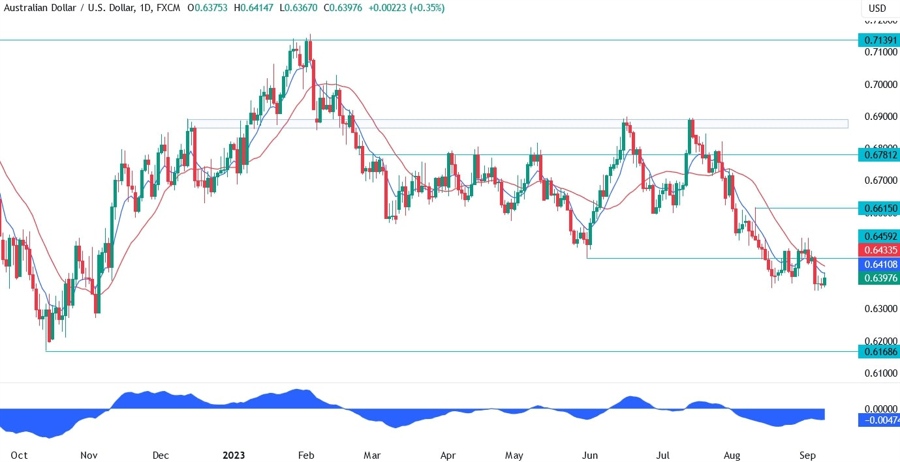
On the daily chart, we can see that AUDUSD is struggling to break below the recent lows although the bearish bias remains as the moving averages are crossed to the downside and the fundamentals are more in favour of the USD. A break below the lows should lead to another selloff and the sellers will keep on targeting the 0.6168 level.
AUDUSD Technical Analysis – 4 hour Timeframe
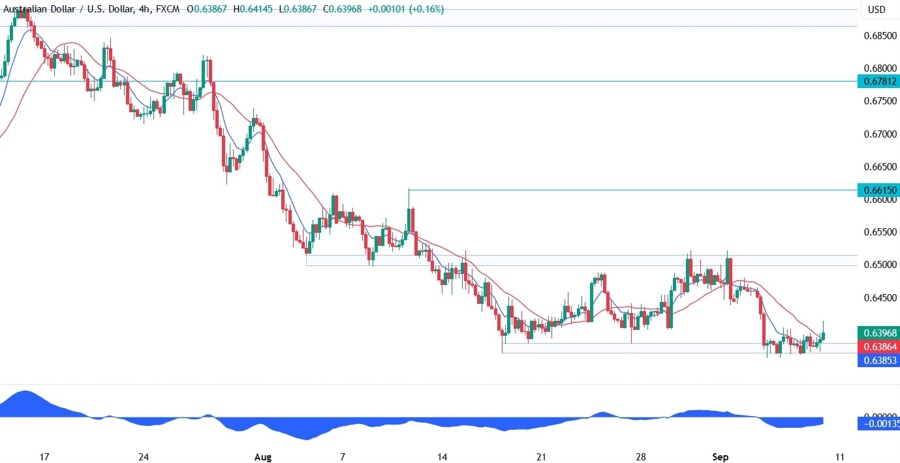
On the 4 hour chart, we can see that we are now basically trading within a range between the 0.6370 support and the 0.6500 resistance. The buyers are likely to pile in here with a defined risk below the support and target the 0.6500 resistance. The sellers, on the other hand, will want to see the price breaking lower to pile in even more and extend the drop to new lows.
AUDUSD Technical Analysis – 1 hour Timeframe
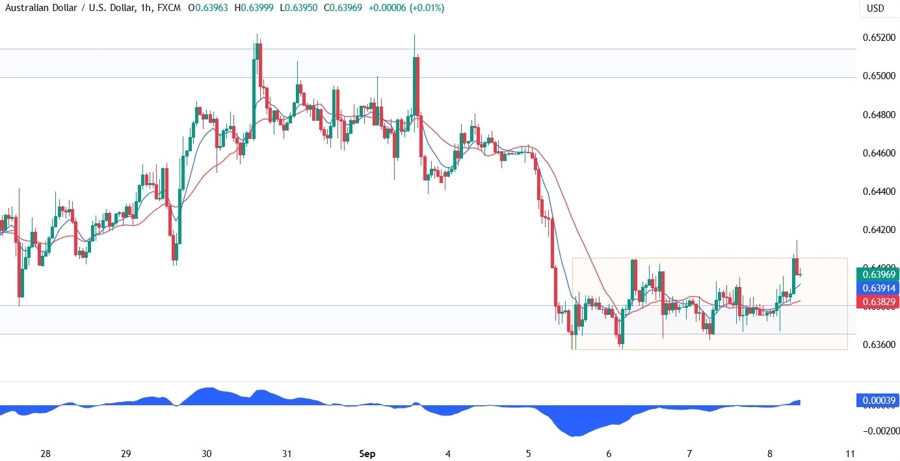
On the 1 hour chart, we can see that we have another mini range in the orange box right at the support zone. A break to the upside should give the buyers a confirmation that we might be heading towards the 0.65 resistance, while a break to the downside will give the sellers the signal to pile in for another selloff.


