US:
- The Fed hiked by 25 bps as expected and kept everything unchanged at the last meeting.
- Inflation expectations and CPI readings continue to show disinflation with the last two Core CPI M/M figures coming in at 0.16%.
- The US PMIs missed expectations across the board last week.
- Fed Chair Powell’s speech at the Jackson Hole Symposium was mostly in line with what he said previously but he stressed on the need to be careful going forward and that continued strength in the labour market may require further rate hikes.
- The first half of the week saw US Job Openings and Consumer Confidence reports missing expectations by a big margin, followed by a miss in the US ADP data and a beat in the US Jobless Claims.
- The market doesn’t expect another hike from the Fed anymore, but a lot will depend on the data going forward.
Australia:
- The RBA kept its cash rate unchanged with a slight tweak to a line in the policy statement that suggests that they are leaning more on the dovish side.
- The RBA Minutes showed that the central bank indeed prefers to keep the cash rate steady.
- The data is supporting the RBA’s stance as the Australian jobs, wages and inflation data all missed expectations.
- The Australian PMIs also missed expectations remaining in contraction.
- The market expects the RBA to hold the cash rate steady in September.
AUDUSD Technical Analysis – Daily Timeframe
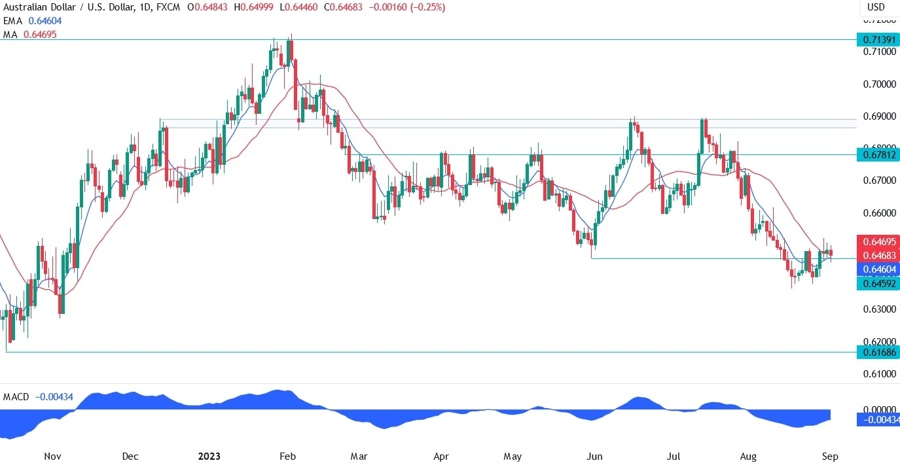
On the daily chart, we can see that AUDUSD is bottoming out around the 0.64 handle and the price is now both above the resistance and the red 21 moving average. This might be an early sign of a bigger correction to the upside to come with the 0.66 handle as the first target. On the other hand, a fall below the support may end up leaving behind a fakeout and trigger a selloff.
AUDUSD Technical Analysis – 4 hour Timeframe
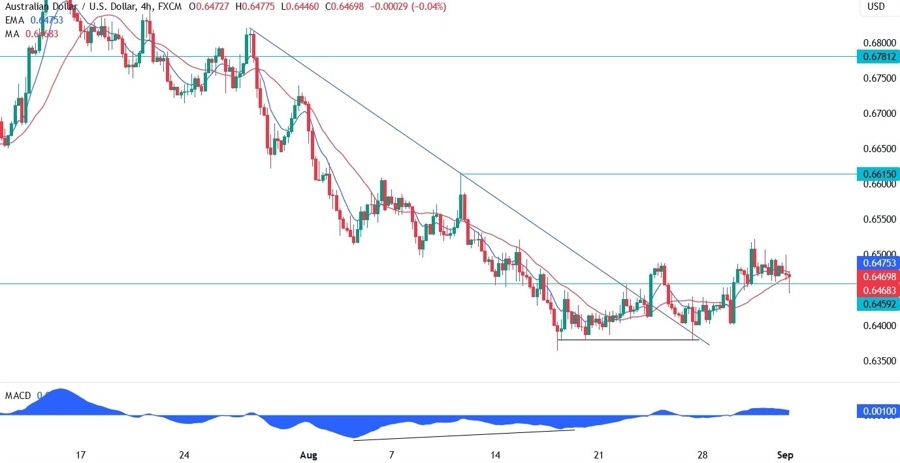
On the 4 hour chart, we can see that we had a divergence with the MACD prior to the breakout of the trendline. This is generally a sign of weakening momentum often followed by pullbacks or reversals. In this case, given the break of the trendline, the chances of a reversal are higher, and the target should be the 0.66 handle. We can see that the buyers are already stepping in around the 0.6459 support and the red 21 moving average to position for a rally into the resistance.
AUDUSD Technical Analysis – 1 hour Timeframe
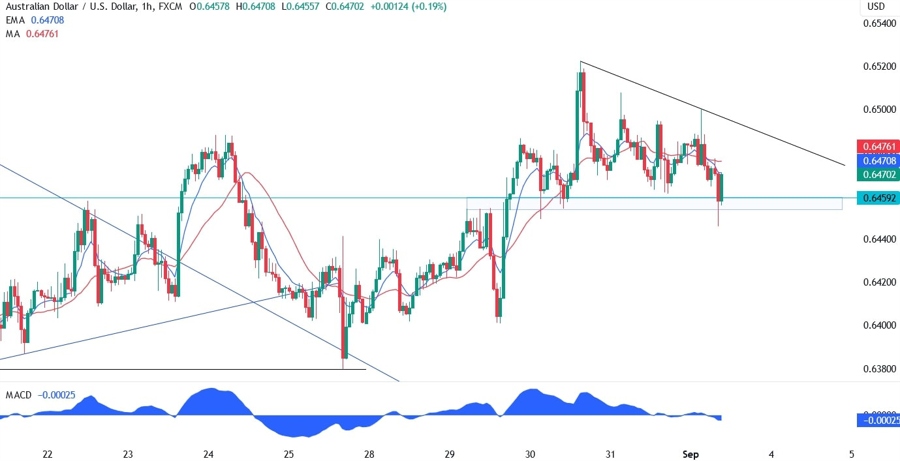
On the 1 hour chart, we can see that the 0.6459 support has been quite strong as the price reacted to it multiple times and it’s now bouncing off of it. The price action formed a descending triangle pattern and generally a breakout on either side leads to a strong and sustained move. So, if the price breaks to the upside, we can expect the buyers to pile in and target the 0.66 resistance. Vice versa, if the price breaks through the support, the sellers will jump in and extend the fall into new lows.
Upcoming Events
Today the market will be focused on the main release of the week: the US NFP report. We will also have the US ISM Manufacturing PMI an hour and a half later, but the labour market data is the priority right now. A bad reading is likely to weaken the US Dollar in the short term, but if the data is really bad, the market may start to fear the recession and the greenback should come back soon after. A good reading is likely to be linked with the soft-landing scenario and might be bearish for the USD as well. Overall, it’s a mixed picture at the moment as the Fed is expected to pause at the September meeting and we might get much worse economic data before the next meeting in November.


