USD
- The Fed left interest rates unchanged as expected at the last meeting and dropped the tightening bias in the statement.
- The US CPI and the US PPI beat expectations for the second consecutive month.
- The NFP report beat expectations on the headline number, but the unemployment rate and the average hourly earnings missed notably. Moreover, the US Jobless Claims beat expectations across the board with a big positive revision to Continuing Claims.
- The latest US ISM Manufacturing PMI missed expectations by a big margin remaining in contraction with the US ISM Services PMI following suit but holding on in expansion.
- The US Retail Sales missed expectations across the board although the data improved from the prior month.
- The market sees basically a 50/50 chance of a hike in June now.
AUD
- The RBA left interest rates unchanged as expected and finally dropped the tightening bias.
- The last Monthly CPI report missed expectations across the board which was a welcome development for the RBA.
- The latest labour market report missed expectations by a big margin.
- The wage price index surprised to the upside as wage growth in Australia remains strong.
- The latest Australian PMIs showed the Manufacturing PMI falling back into contraction while the Services PMI jumped back into expansion.
- The market expects the first rate cut in August.
AUDUSD Technical Analysis – Daily Timeframe
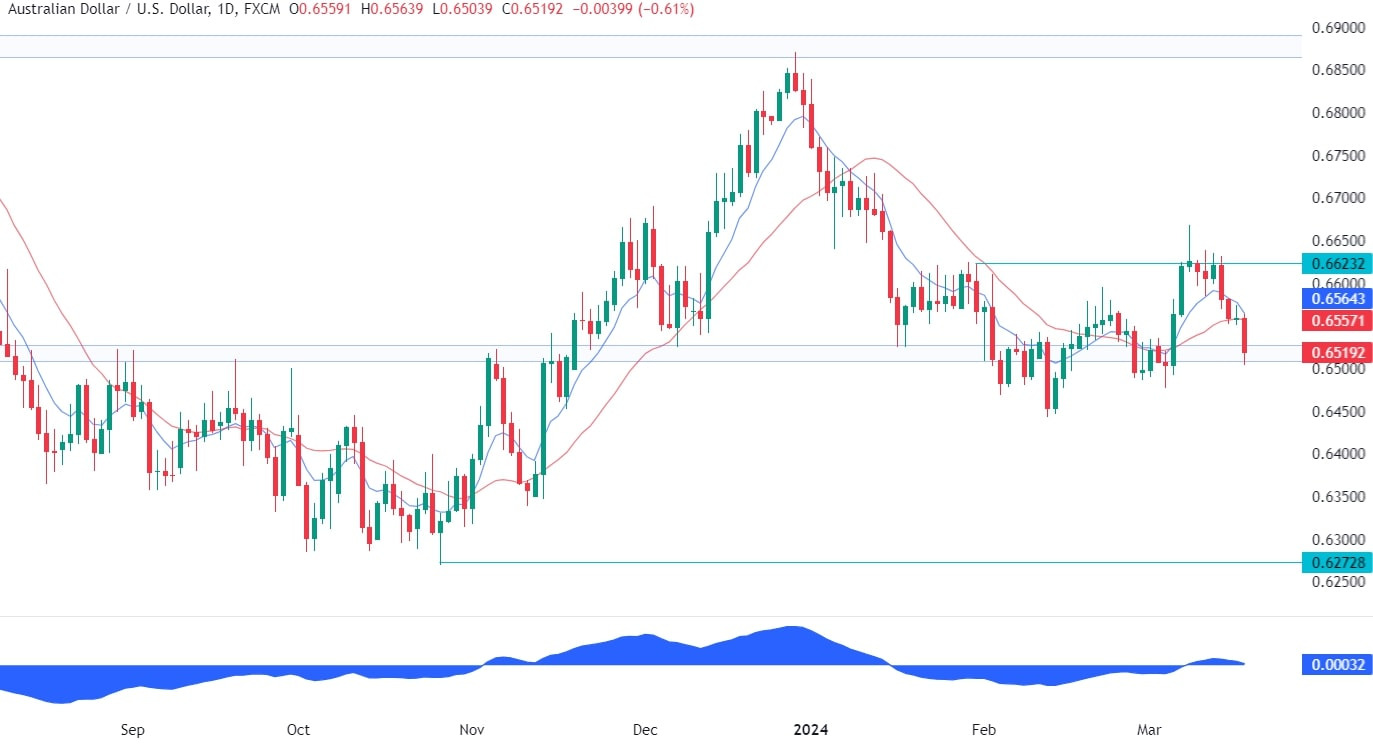
On the daily chart, we can see that AUDUSD fell all the way back to the key support zone around the 0.65 handle with the latest selloff coming after the RBA dropped the tightening bias. This is where we can expect the buyers to step in with a defined risk below the support to position for a rally back into the highs. The sellers, on the other hand, will want to see the price breaking lower to increase the bearish bets into the 0.63 handle.
AUDUSD Technical Analysis – 4 hour Timeframe
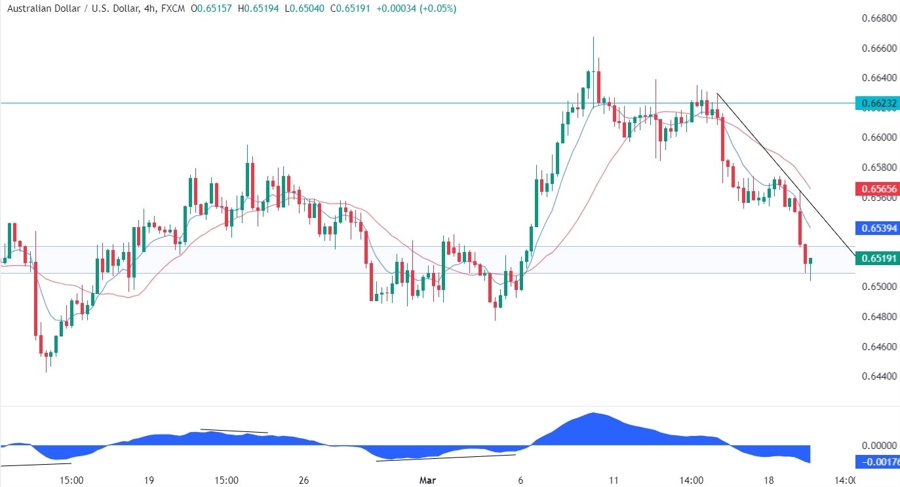
On the 4 hour chart, we can see that we have now a trendline where we can also find the red 21 moving average for confluence. If we were to get a pullback from here, we can expect the sellers to lean on the trendline with a defined risk above it to position for the break below the support with a better risk to reward setup. The buyers, on the other hand, will want to see the price breaking higher to invalidate the bearish setup and increase the bullish bets into the highs.
AUDUSD Technical Analysis – 1 hour Timeframe
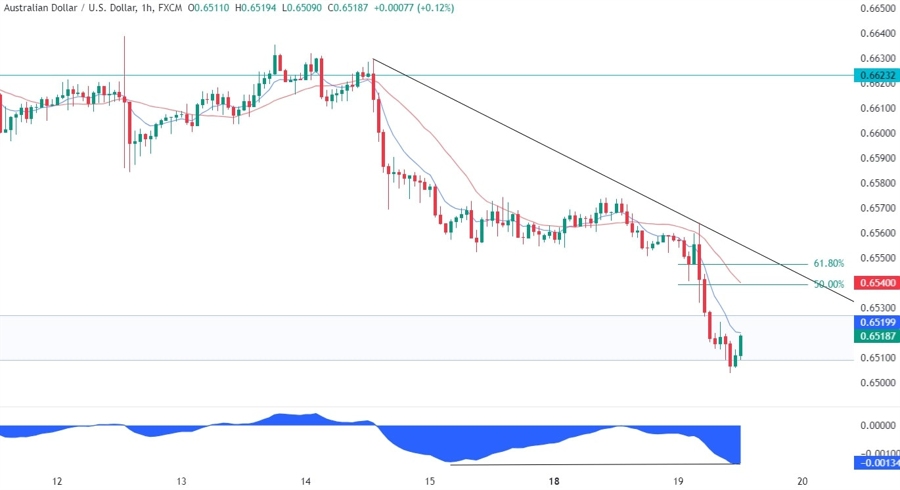
On the 1 hour chart, we can see that the latest leg lower is diverging with the MACD, which is generally a sign of weakening momentum often followed by pullbacks or reversals. In this case, it might be a signal for a pullback into the trendline where we can also find the Fibonacci retracement levels for extra confluence.
Upcoming Events
Tomorrow we have the FOMC rate decision on the agenda where the central bank is expected to keep rates unchanged. On Thursday, we get the Australian PMIs and jobs data, while later in the day we will see the latest US PMIs and Jobless Claims figures.


