USD
- The Fed left interest rates unchanged as expected while dropping the tightening bias in the statement but adding a slight pushback against a March rate cut.
- Fed Chair Powell stressed that they want to see more evidence of inflation falling back to target and that a rate cut in March is not their base case.
- The US CPI beat expectations for the second consecutive month with the disinflationary trend reversing.
- The US Initial Claims beat expectations while Continuing Claims missed. Overall, the data remains steady.
- The ISM Manufacturing PMI surprised to the upside with the new orders index, which is considered a leading indicator, jumping back into expansion. Similarly, the ISM Services PMI beat expectations across the board with the employment sub-index erasing the prior drop and prices paid jumping above 60.
- The US Retail Sales missed expectations across the board by a big margin.
- The market now expects the first rate cut in June.
AUD
- The RBA left interest rates unchanged as expected with the central bank maintaining the usual tightening bias and data dependent language.
- The recent Monthly CPI report missed expectations across the board which was a welcome development for the RBA.
- The latest labour market report missed expectations by a big margin.
- The wage price index surprised to the upside as wage growth in Australia remains strong.
- The latest Australian PMIs improved with the Manufacturing measure bouncing back into expansion while the Services one remains in contraction.
- The market expects the first rate cut in June.
AUDUSD Technical Analysis – Daily Timeframe
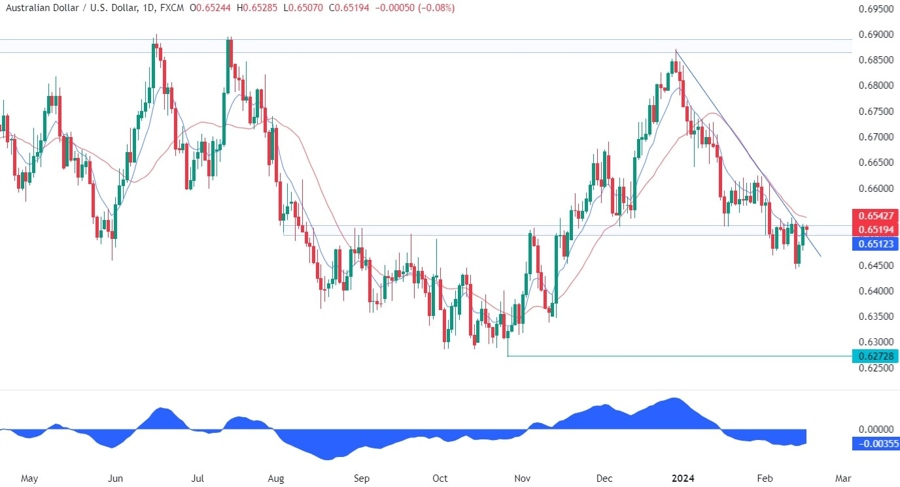
On the daily chart, we can see that AUDUSD is now breaking above the trendline and the support-turned-resistance around the 0.6520 level. The buyers will need the pair to rally above the red 21 moving average to confirm the change in trend. The sellers, on the other hand, will likely pile in around the moving average to position for a drop into new lows.
AUDUSD Technical Analysis – 4 hour Timeframe
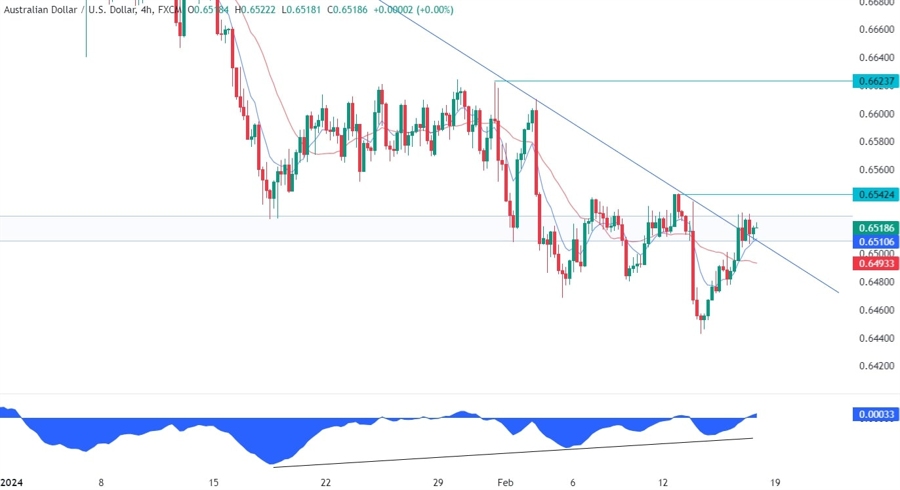
On the 4 hour chart, we can see that the price has been diverging with the MACD for quite a while. This is generally a sign of weakening momentum often followed by pullbacks or reversals. In this case, a break above the 0.6542 level should confirm a reversal and trigger a strong move to the upside as the buyers will likely pile in more aggressively. This will be a key level for the sellers as that’s where the daily 21 moving average is standing.
AUDUSD Technical Analysis – 1 hour Timeframe
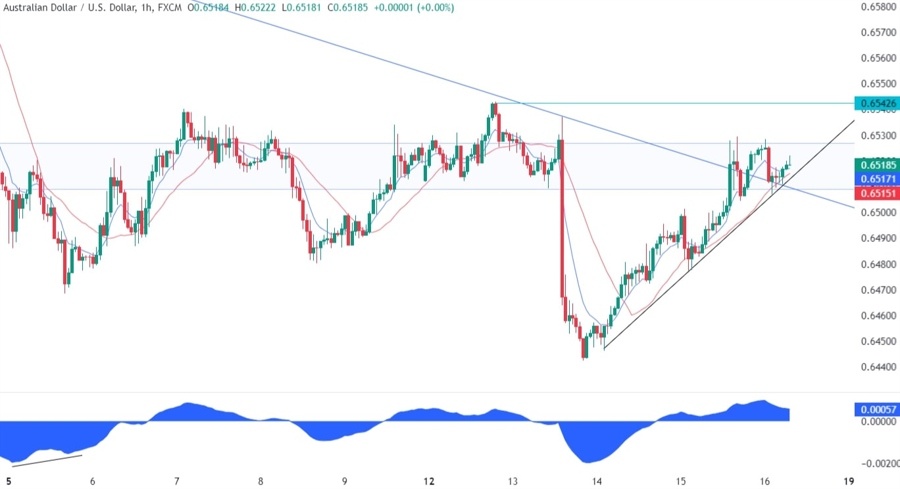
On the 1 hour chart, we can see that we have an upward trendline defining the current bullish momentum. This is where the buyers are stepping in as they have also the confluence with the red 21 moving average. The sellers, on the other hand, will want to see the price breaking lower to pile in and target new lows.
Upcoming Events
Today we get the US PPI data and the University of Michigan Consumer Sentiment survey.


