USD
- The Fed left interest rates unchanged as expected while dropping the tightening bias in the statement but adding a slight pushback against a March rate cut.
- Fed Chair Powell stressed that they want to see more evidence of inflation falling back to target and that a rate cut in March is not their base case.
- The latest US GDP beat expectations by a big margin.
- The US PCE came mostly in line with expectations with the Core 3-month and 6-month annualised rates falling below the Fed’s 2% target.
- The US NFP report beat expectations across the board by a big margin.
- The ISM Manufacturing PMI surprised to the upside with the new orders index, which is considered a leading indicator, jumping back into expansion. Similarly, the ISM Services PMI beat expectations across the board with the employment sub-index erasing the prior drop and prices paid jumping above 60.
- The US Consumer Confidence report came in line with expectations but the labour market details improved considerably.
- The market now expects the first rate cut in May.
AUD
- The RBA left interest rates unchanged as expected with the central bank maintaining the usual tightening bias and data dependent language.
- The recent Monthly CPI report missed expectations across the board which was a welcome development for the RBA.
- The latest labour market report missed expectations by a big margin.
- The wage price index surprised to the upside as wage growth in Australia remains strong.
- The latest Australian PMIs improved with the Manufacturing measure bouncing back into expansion while the Services one remains in contraction.
- The market expects the RBA to start cutting rates in August.
AUDUSD Technical Analysis – Daily Timeframe
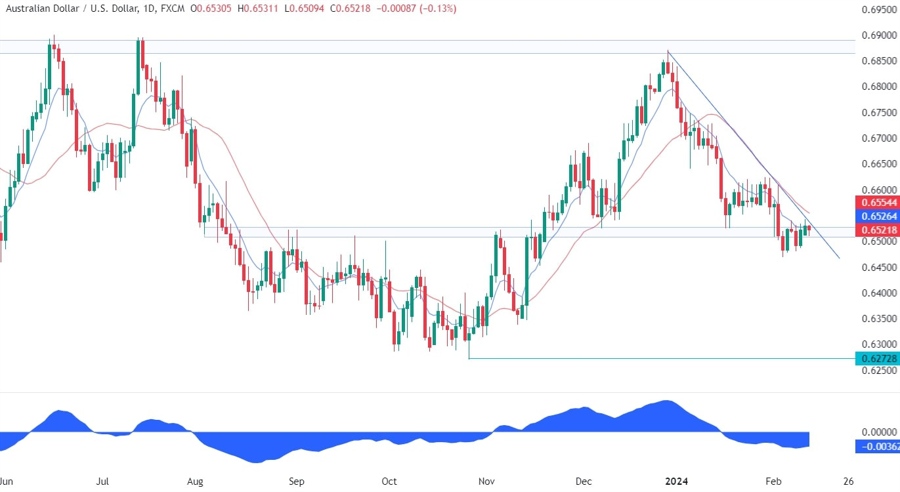
On the daily chart, we can see that AUDUSD pulled back to retest the trendline where we can also find the red 21 moving average for confluence. This is where the sellers stepped in with a defined risk above the trendline to position for a drop into new lows. The buyers, on the other hand, will want to see the price breaking higher to invalidate the bearish setup and start targeting new highs.
AUDUSD Technical Analysis – 4 hour Timeframe
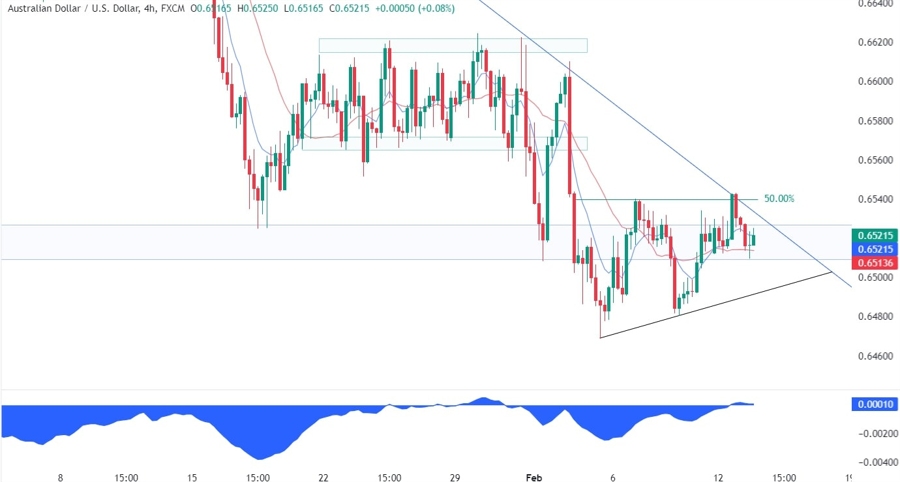
On the 4 hour chart, we can see that the sellers had some extra confluence around the trendline with the pair rejecting the 50% Fibonacci retracement level. This could now become an ascending triangle defined by the Fibonacci level and the bottom trendline. The price can break on either side of the pattern but what follows next is generally a strong and sustained move in the direction of the breakout.
AUDUSD Technical Analysis – 1 hour Timeframe
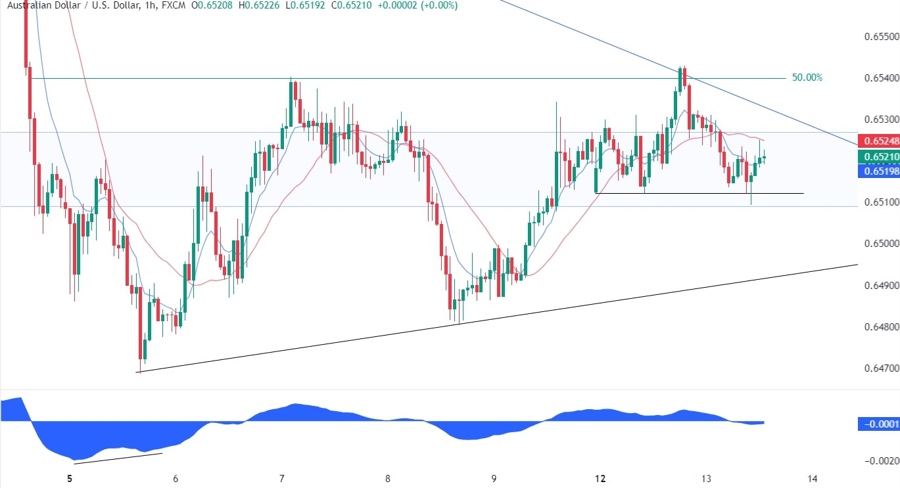
On the 1 hour chart, we can see that we have a minor support level around 0.6512. If the price were to break below it, we can expect the sellers to increase the bearish bets into the upward trendline around the 0.6490 level targeting a break below it. The buyers, on the other hand, will want to split their orders to enter both at the 0.6512 support and the trendline in case the price were to break lower.
Upcoming Events
Today we have the main event of the week, that is, the US CPI report. On Thursday we will get the Australian Labour Market report and later in the day, the latest US Jobless Claims figures and the US Retail Sales. Finally, on Friday, we conclude the week with the US PPI data and the University of Michigan Consumer Sentiment survey.


