USD
- The Fed left interest rates unchanged as expected while dropping the tightening bias in the statement but adding a slight pushback against a March rate cut.
- Fed Chair Powell stressed that they want to see more evidence of inflation falling back to target and that a rate cut in March is not their base case.
- The latest US GDP beat expectations by a big margin.
- The US PCE came mostly in line with expectations with the Core 3-month and 6-month annualised rates falling below the Fed’s 2% target.
- The US NFP report beat expectations across the board by a big margin.
- The ISM Manufacturing PMI surprised to the upside with the new orders index, which is considered a leading indicator, jumping back into expansion. Similarly, the ISM Services PMI beat expectations across the board with the employment sub-index erasing the prior drop and prices paid jumping above 60.
- The US Consumer Confidence report came in line with expectations but the labour market details improved considerably.
- The market now expects the first rate cut in May.
AUD
- The RBA left interest rates unchanged as expected with the central bank maintaining the usual tightening bias and data dependent language.
- The recent Monthly CPI report missed expectations across the board which was a welcome development for the RBA.
- The latest labour market report missed expectations by a big margin.
- The wage price index surprised to the upside as wage growth in Australia remains strong.
- The latest Australian PMIs improved with the Manufacturing measure bouncing back into expansion while the Services one remains in contraction.
- The market expects the RBA to start cutting rates in June.
AUDUSD Technical Analysis – Daily Timeframe
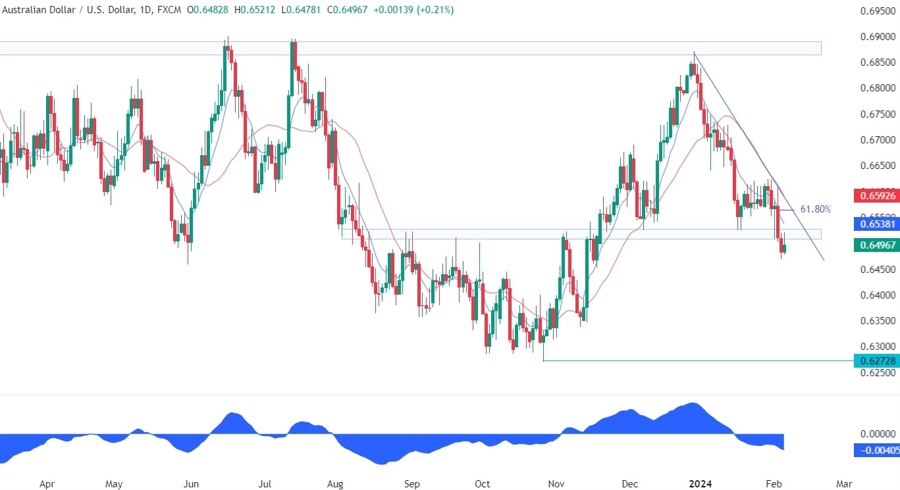
On the daily chart, we can see that AUDUSD broke through the key support zone around the 0.65 handle and pulled back to retest the level. The sellers should keep on looking to sell the rallies with the first opportunity coming around the support now turned resistance and the second around the trendline and the 61.8% Fibonacci retracement level. The buyers, on the other hand, will need the price to break above the trendline to invalidate the bearish bias and start targeting new highs.
AUDUSD Technical Analysis – 4 hour Timeframe
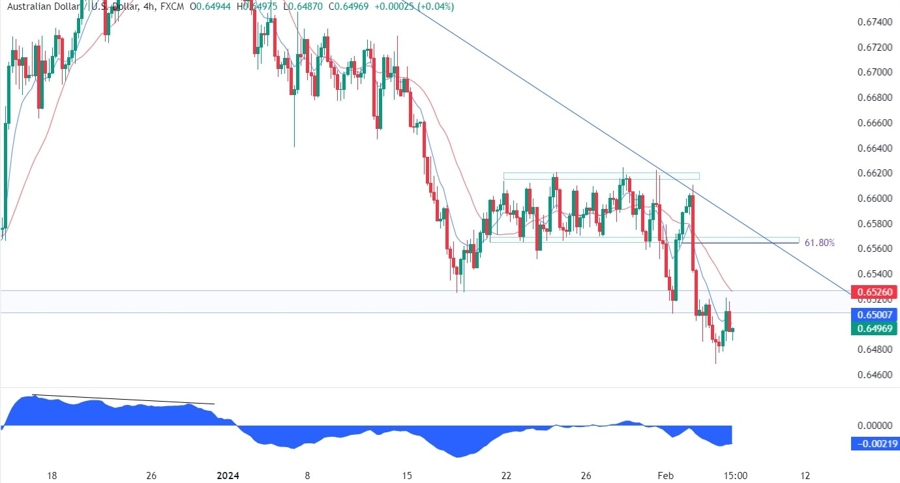
On the 4 hour chart, we can see that we have also red 21 moving average for confluence at the resistance zone. If the price were to break higher, the buyers will likely pile in to position for a rally into the trendline and ultimately target a break above it. The sellers, on the other hand, will take it as an opportunity to position for new lows with an even better risk to reward setup.
AUDUSD Technical Analysis – 1 hour Timeframe
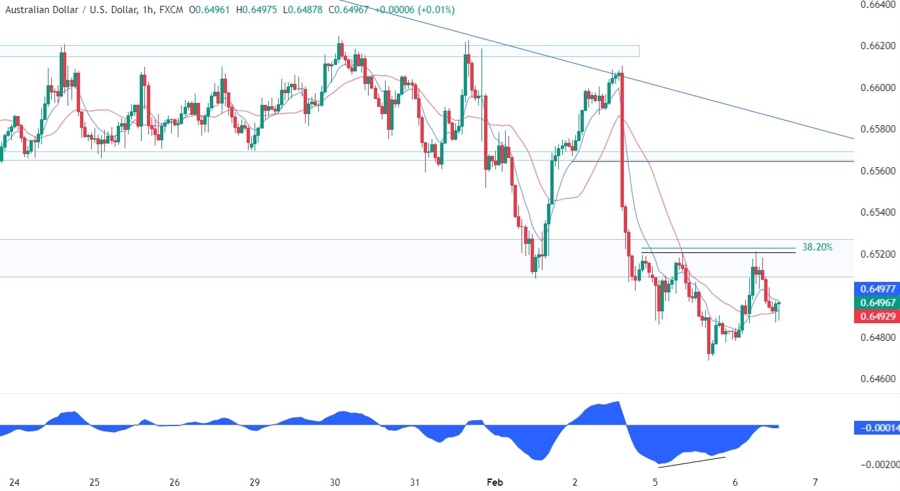
On the 1 hour chart, we can see more closely the recent price action and we can notice that the latest leg lower diverged with the MACD. This is generally a sign of weakening momentum often followed by pullbacks or reversals. In this case, we got the pullback into the most recent swing high where we can also find the 38.2% Fibonacci retracement level for confluence. This is where the sellers are likely to continue to step in with a defined risk above the level to position for a drop into new lows, while the buyers will look for a break to the upside to increase the bullish bets into the major trendline.
Upcoming Events
This week is basically empty on the data front with just the latest US Jobless Claims figures on Thursday being the only notable release.


