USD
- The Fed left interest rates unchanged as expected at the last meeting with a shift in the statement that indicated the end of the tightening cycle.
- The US GDP beat expectations by a big margin.
- The US PCE came mostly in line with expectations and the Core 3-month and 6-month annualised rates are now below the Fed’s 2% target.
- The labour market continues to soften but remains resilient with US Jobless Claims missing expectations last week but hovering around cycle lows.
- The latest US PMIs beat expectations by a big margin for both the Manufacturing and Services measures.
- The US Retail Sales beat expectations across the board.
- The University of Michigan Consumer Sentiment report jumped to the highest levels since 2021.
- The Fed members recently have been pushing back on the aggressive rate cuts expectations.
- The market sees a 50/50 chance of a rate cut in March.
AUD
- The RBA left interest rates unchanged as expected at the last meeting with the central bank maintaining the usual data dependent language.
- The recent Monthly CPI report missed expectations across the board which was a welcome development for the RBA.
- The latest labour market report missed expectations by a big margin.
- The wage price index surprised to the upside as wage growth in Australia remains strong.
- The latest Australian PMIs improved with the Manufacturing measure bouncing back into expansion while the Services one remains in contraction.
- The market expects the RBA to start cutting rates in August.
AUDUSD Technical Analysis – Daily Timeframe
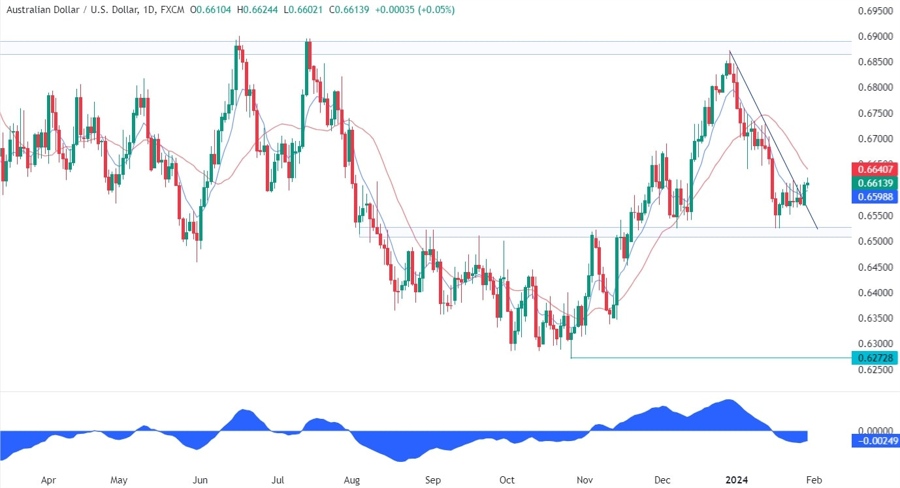
On the daily chart, we can see that AUDUSD yesterday broke through the key trendline and rallied into the recent highs around the 0.6620 level. This breakout opened the door for a rally back into the 0.69 resistance and the buyers piled in with a defined risk below the yesterday’s low. We will see in the next few days if this was just a fakeout but anyway the support zone around the 0.6520 level will be the last line of defence for the buyers.
AUDUSD Technical Analysis – 4 hour Timeframe
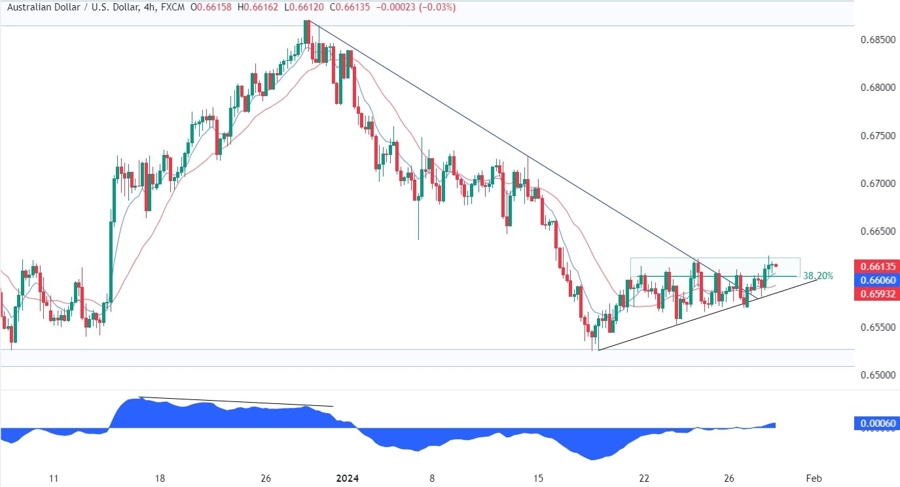
On the 4 hour chart, we can see that we have a strong resistance zone around the 0.6620 level as the price has been getting rejected multiple times. This is where the sellers are piling in with a defined risk above the resistance zone to position for another extension to the downside. The buyers, on the other hand, will want to see the price breaking higher to increase the bullish bets into the 0.69 resistance.
AUDUSD Technical Analysis – 1 hour Timeframe
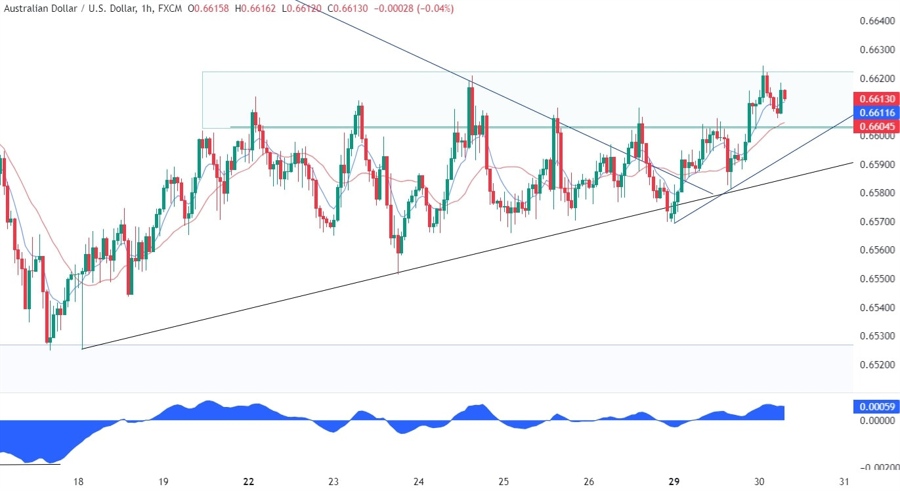
On the 1 hour chart, we can see more closely the recent price action and we can notice that we have another minor trendline where the buyers can lean onto to position for a breakout. Given that the price could bounce either from the minor or major trendline, the buyers might want to split their positions. The sellers, on the other hand, will want to see the price breaking below the major trendline to increase the bearish bets into new lows.
Upcoming Events
This week is going to be a really busy one with the FOMC rate decision and lots of economic data on the agenda. We begin today with the US Job Openings and the US Consumer Confidence reports. Tomorrow we will see the Australian CPI and later in the day the US Employment Cost Index and the ADP data before the FOMC rate decision. On Thursday, we get the latest US Jobless Claims figures and the ISM Manufacturing PMI. Finally, on Friday, we conclude the week with the US NFP report.


