USD
- The Fed left interest rates unchanged as expected at the last meeting with a shift in the statement that indicated the end of the tightening cycle.
- The US GDP beat expectations by a big margin.
- The latest US CPI slightly beat expectations but analysts expect the Core PCE to print at 0.2% M/M again following the CPI data.
- The labour market continues to soften but remains resilient with US Jobless Claims missing expectations this week but hovering around cycle lows.
- The latest US PMIs beat expectations by a big margin for both the Manufacturing and Services measures.
- The US Retail Sales beat expectations across the board.
- The University of Michigan Consumer Sentiment report jumped to the highest levels since 2021.
- The Fed members recently have been pushing back on the aggressive rate cuts expectations.
- The market sees 50/50 chance of a rate cut in March.
AUD
- The RBA left interest rates unchanged as expected at the last meeting with the central bank maintaining the usual data dependent language.
- The recent Monthly CPI report missed expectations across the board which is another welcome development for the RBA.
- The latest labour market report missed expectations by a big margin.
- The wage price index surprised to the upside as wage growth in Australia remains strong.
- The latest Australian PMIs improved with the Manufacturing measure bouncing back into expansion while the Services one remains in contraction.
- The market expects the RBA to start cutting rates in Q3.
AUDUSD Technical Analysis – Daily Timeframe
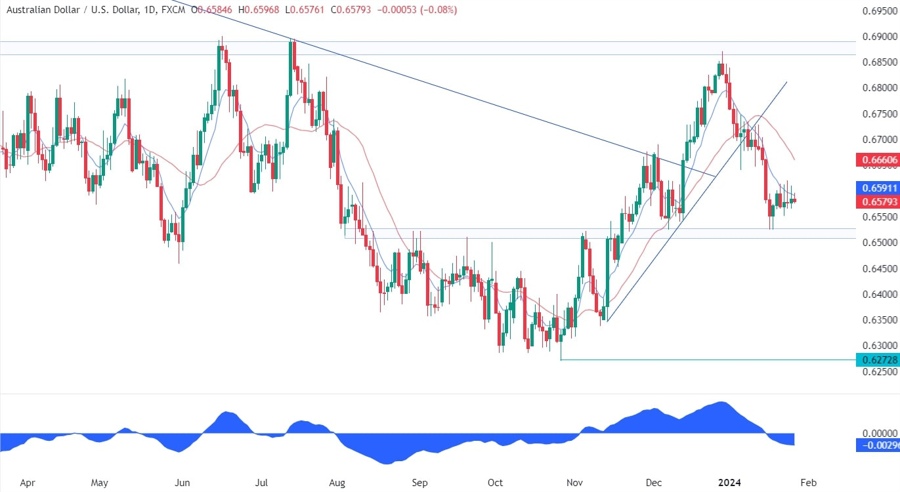
On the daily chart, we can see that AUDUSD bounced on the key support zone around the 0.65 handle as the price got overstretched on the downside as depicted by the distance from the blue 8 moving average. In such instances, we can generally see a pullback into the moving average or some consolidation before the next move. We indeed got a pullback into the moving average where the sellers have been piling in for the last few days.
AUDUSD Technical Analysis – 4 hour Timeframe
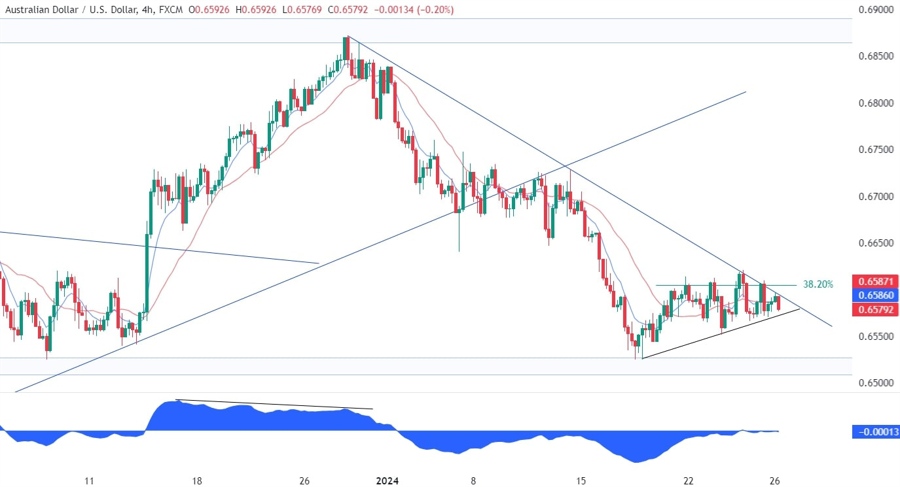
On the 4 hour chart, we can see that we have a strong resistance zone around the 0.66 handle as we have the confluence with the downward trendline and the 38.2% Fibonacci retracement level. This is where the sellers are piling in with a defined risk above the trendline to position for a breakout below the key support. The buyers, on the other hand, will want to see the price breaking above the trendline to invalidate the bearish setup and position for a rally back into the 0.69 resistance.
AUDUSD Technical Analysis – 1 hour Timeframe
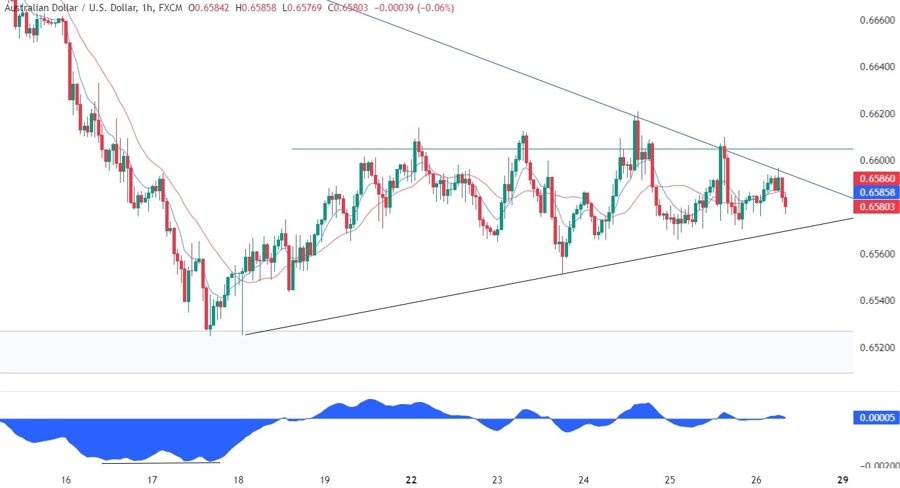
On the 1 hour chart, we can see that the pair has been consolidating around the 0.66 handle as the buyers and sellers continue to battle for key breakouts. In fact, a breakout above the downward trendline should see the sellers folding and the buyers extending the rally into new highs. Conversely, a breakout below the upward trendline should see the sellers increasing the bearish bets into the key support and beyond.
Upcoming Events
Today the only notable release will be the US PCE report.


