USD
- The Fed left interest rates unchanged as expected at the last meeting with a shift in the statement that indicated the end of the tightening cycle.
- The latest US CPI slightly beat expectations but analysts expect the Core PCE to print at 0.2% M/M again following the CPI data.
- The labour market continues to soften but remains resilient with US Jobless Claims beating expectations week after week.
- The latest ISM Manufacturing PMI beat expectations, while the ISM Services PMI missed by a big margin.
- The US Retail Sales beat expectations across the board.
- The University of Michigan Consumer Sentiment report jumped to the highest levels since 2021.
- The Fed members recently have been pushing back on the aggressive rate cuts expectations.
- The market’s expectations for the first rate cut were pushed back to May following strong economic data.
AUD
- The RBA left interest rates unchanged as expected at the last meeting with the central bank maintaining the usual data dependent language.
- The recent Monthly CPI report missed expectations across the board which is another welcome development for the RBA.
- The latest labour market report missed expectations by a big margin.
- The wage price index surprised to the upside as wage growth in Australia remains strong.
- The latest Australian PMIs improved but remain in contraction.
- The market expects the RBA to start cutting rates in June.
AUDUSD Technical Analysis – Daily Timeframe

On the daily chart, we can see that AUDUSD bounced on the key support zone around the 0.65 handle as the price got overstretched on the downside as depicted by the distance from the blue 8 moving average. In such instances, we can generally see a pullback into the moving average or some consolidation before the next move. We indeed got a pullback into the moving average where the sellers are likely to step in to target a break below the support.
AUDUSD Technical Analysis – 4 hour Timeframe
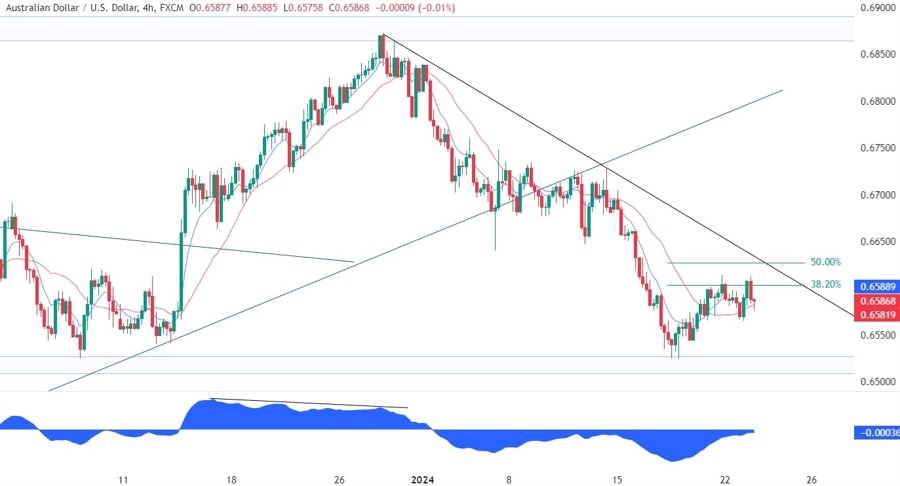
On the 4 hour chart, we can see that we have a strong resistance zone around the 0.66 handle as we have the confluence with the downward trendline and the Fibonacci retracement levels. This is where the sellers will keep on piling in with a defined risk above the trendline to position for a breakout below the key support. The buyers, on the other hand, will want to see the price breaking above the trendline to invalidate the bearish setup and position for a rally back into the highs.
AUDUSD Technical Analysis – 1 hour Timeframe
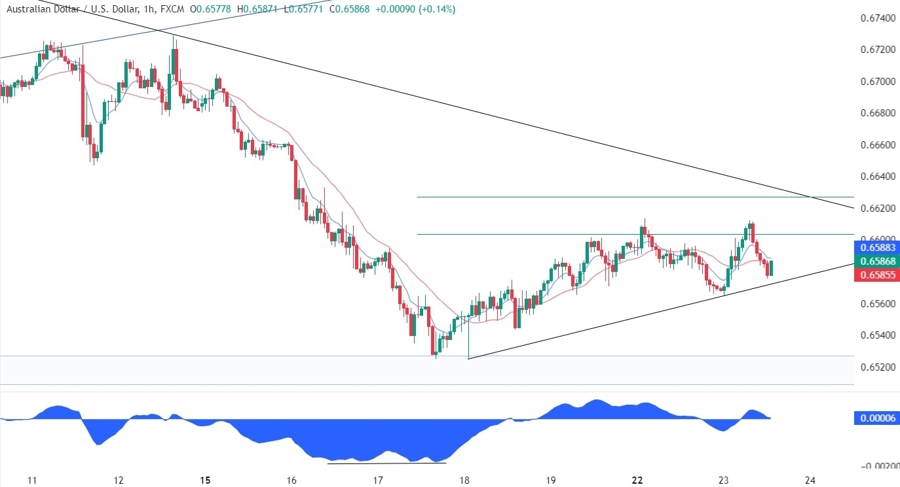
On the 1 hour chart, we can see more closely the current price action with the pair reacting to the resistance zone defined by the Fibonacci retracement levels. From a risk management perspective, the buyers now have a better risk to reward setup around the upward trendline where they can position for a breakout above the major trendline with a defined risk below the trendline. The sellers, on the other hand, will want to see the price breaking lower to increase the bearish bets into the support zone targeting a breakout.
Upcoming Events
This week is a bit more tranquil on the data front with the major releases scheduled for the final part of the week. We begin tomorrow with the Eurozone and the US PMIs. On Thursday, we have the ECB rate decision and later in the day the Advance US Q4 GDP and the latest US Jobless Claims figures. Finally, on Friday we conclude the week with the US PCE report.


