USD
- The Fed left interest rates unchanged as expected at the last meeting with a shift in the statement that indicated the end of the tightening cycle.
- The Summary of Economic Projections showed a downward revision to Growth and Core PCE in 2024 while the Unemployment Rate was left unchanged. Moreover, the Dot Plot was revised to show three rate cuts in 2024 compared to just two in the last projection.
- Fed Chair Powell didn't push back against the strong dovish pricing and even said that they are focused on not making the mistake of holding rates high for too long.
- The latest US PCE missed expectations across the board with the Core 6-month annualised rate falling below the Fed’s target at 1.9%.
- The NFP report beat expectations although there was more weakness under the hood.
- The latest ISM Manufacturing PMI beat expectations, while the ISM Services PMI missed by a big margin.
- The hawkish Fed members have been leaning on a more neutral side lately.
- The market expects the Fed to start cutting rates in Q1 2024.
AUD
- The RBA left interest rates unchanged as expected at the last meeting with the central bank maintaining the usual data dependent language.
- The recent Monthly CPI report missed expectations across the board which was a welcome development for the RBA.
- The RBA Governor Bullock has been leaning on a more hawkish side, although she remains optimistic on the future outlook.
- The latest labour market report beat forecasts across the board although the unemployment rate rose more than expected.
- The wage price index surprised to the upside as wage growth in Australia remains strong.
- The Australian PMIs improved recently but remain in contraction.
- The market expects the RBA to start cutting rates in Q2 2024.
AUDUSD Technical Analysis – Daily Timeframe
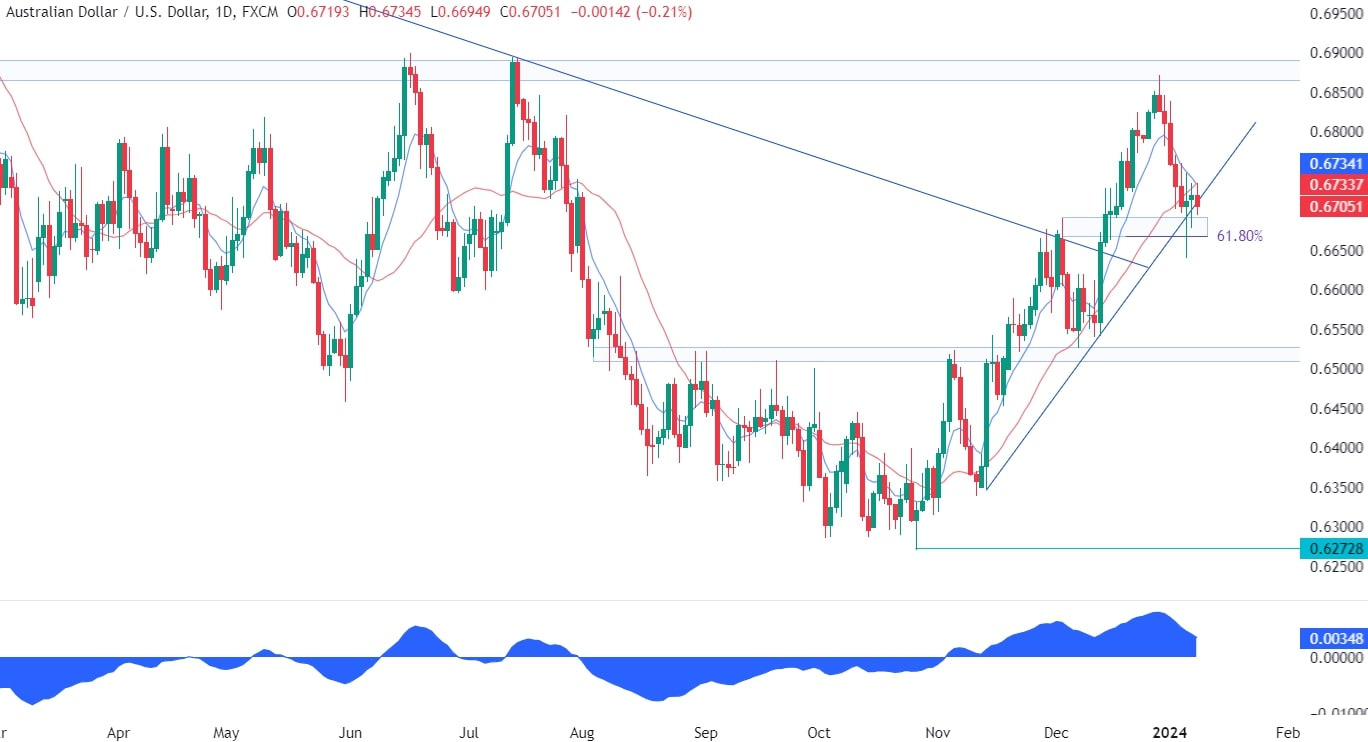
On the daily chart, we can see that AUDUSD bounced recently on the key trendline where we had the confluence with the 61.8% Fibonacci retracement level and the previous swing high level. The buyers stepped in to position for a rally back into the highs. The sellers, on the other hand, will want to see the price breaking lower to invalidate the bullish setup and position for a drop into the 0.65 support.
AUDUSD Technical Analysis – 4 hour Timeframe
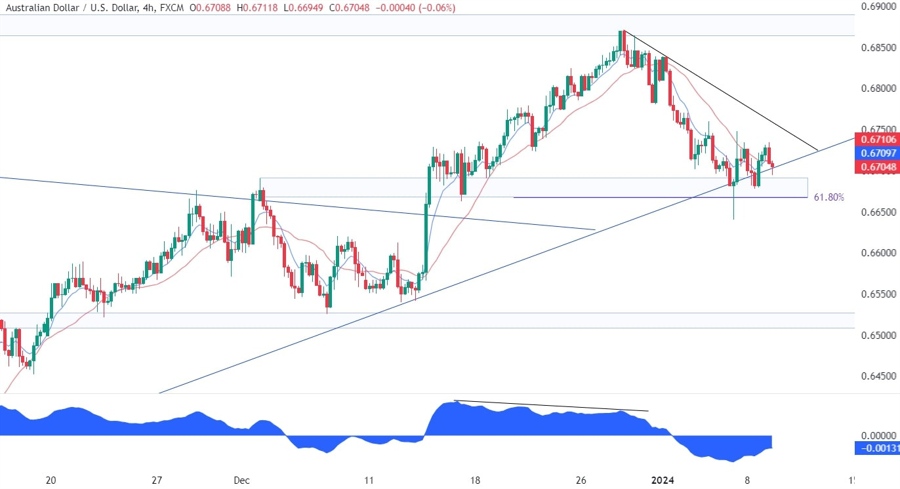
On the 4 hour chart, we can see that the pair was diverging with the MACD as it approached the key resistance zone around the 0.69 handle. This is generally a sign of weakening momentum often followed by pullbacks or reversals. In this case, the target for the pullback was right around the trendline, which is where the price bounced off of. The buyers will need the price to break above the downward trendline to increase the bullish bets into the 0.69 resistance.
AUDUSD Technical Analysis – 1 hour Timeframe
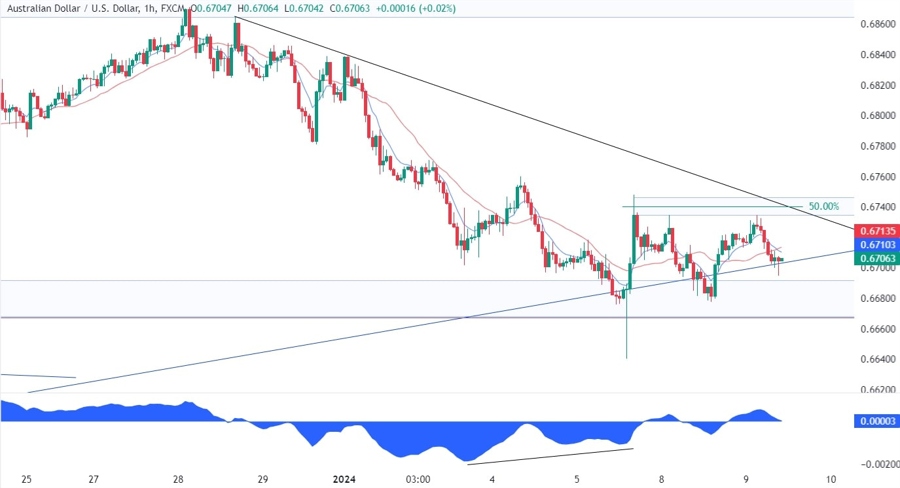
On the 1 hour chart, we can see that the recent leg lower into the support zone around the 0.6680 level diverged with the MACD. This has led to a pullback and the pair is now consolidating between the support zone and the downward trendline. A break to the upside should lead to a rally into the 0.69 resistance while a break to the downside is likely to trigger a selloff into the 0.65 support.
Upcoming Events
Tomorrow we have the Australian Monthly CPI data. On Thursday, we will get the latest US CPI report and the US Jobless Claims figures. Finally, on Friday, we conclude the week with the US PPI data.


