USD
- The Fed left interest rates unchanged as expected at the last meeting with a shift in the statement that indicated the end of the tightening cycle.
- The Summary of Economic Projections showed a downward revision to Growth and Core PCE in 2024 while the Unemployment Rate was left unchanged. Moreover, the Dot Plot was revised to show three rate cuts in 2024 compared to just two in the last projection.
- Fed Chair Powell didn't push back against the strong dovish pricing and even said that they are focused on not making the mistake of holding rates high for too long.
- The latest US PCE missed expectations across the board with the Core 6-month annualised rate falling below the Fed’s target at 1.9%.
- The labour market has been softening via less job opportunities rather than more layoffs with the Initial Claims hovering around cycle lows and Continuing Claims remaining high.
- The latest ISM Manufacturing PMI missed expectations falling further into contraction, while the ISM Services PMI beat forecasts holding on in expansion.
- The market expects the Fed to start cutting rates in Q1 2024.
AUD
- The RBA left interest rates unchanged as expected at the last meeting with the central bank maintaining the usual data dependent language.
- The recent Monthly CPI report missed expectations across the board which was a welcome development for the RBA.
- The RBA Governor Bullock has been leaning on a more hawkish side, although she remains optimistic on the future outlook.
- The latest labour market report beat forecasts across the board although the unemployment rate rose more than expected.
- The wage price index surprised to the upside as wage growth in Australia remains strong.
- The Australian PMIs improved recently but remain in contraction.
- The market expects the RBA to start cutting rates in Q2 2024.
AUDUSD Technical Analysis – Daily Timeframe
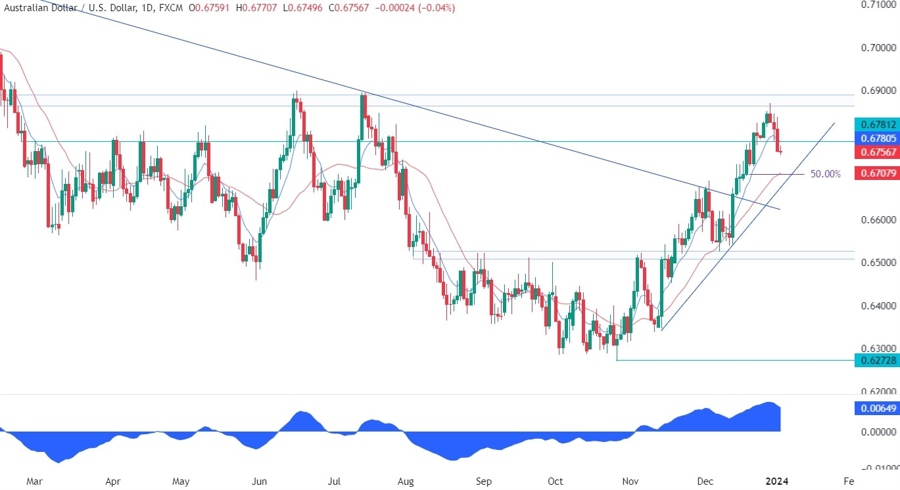
On the daily chart, we can see that AUDUSD recently reached the key resistance zone around the 0.69 handle and sold off. We can see that we have a good support zone around the trendline where we can also find the confluence with the 50% Fibonacci retracement level and the red 21 moving average. This is where we can expect the buyers to step in with a defined risk below the trendline to position for a rally into a new high.
AUDUSD Technical Analysis – 4 hour Timeframe
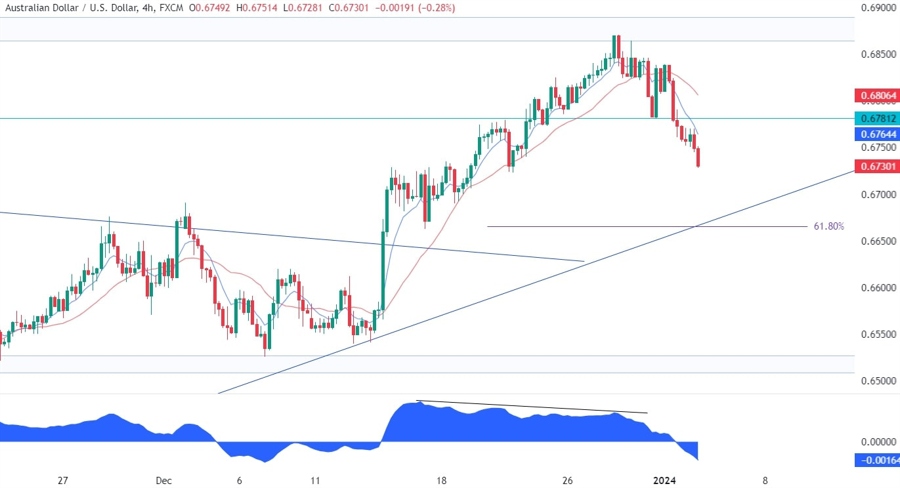
On the 4 hour chart, we can see that the pair was diverging with the MACD as it approached the key resistance zone. This is generally a sign of weakening momentum often followed by pullbacks or reversals. In this case, we should see at least a pullback into the trendline where the buyers will look to buy from. The sellers, on the other hand, will want to see the price breaking lower to invalidate the bullish setup and increase the bearish bets into the 0.65 handle.
AUDUSD Technical Analysis – 1 hour Timeframe
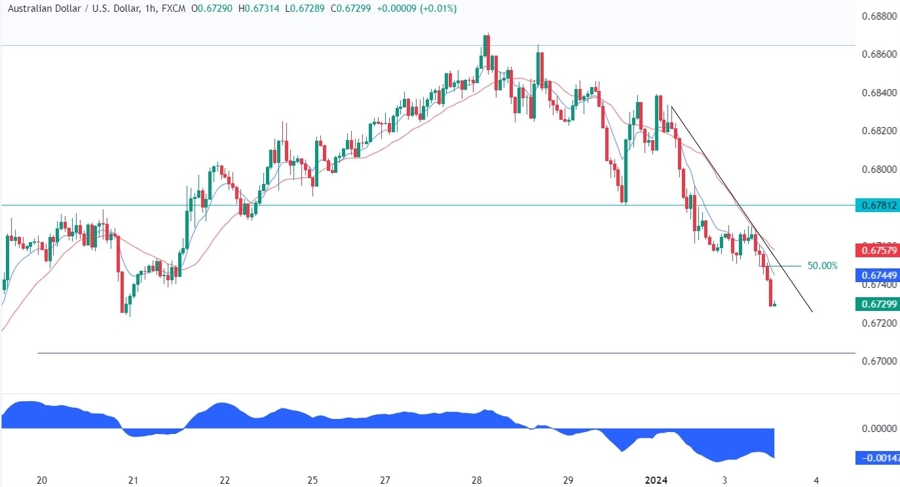
On the 1 hour chart, we can see more closely the current price action with a possible entry for late sellers. In fact, we can see that we have a good confluence around the 0.6750 level where we can find the trendline, the 50% Fibonacci retracement level and the red 21 moving average. That’s where the sellers can lean onto to position for further downside. The buyers, on the other hand, will want to see the price breaking higher to position for a rally into the 0.6780 level.
Upcoming Events
This week is full of key economic data which will culminate with the NFP report on Friday. We begin today with the US ISM Manufacturing PMI and Job Openings and given the recent trends there could be room for disappointment. Later in the day, we will get the release of the FOMC Minutes, but it’s not expected to be market-moving given that it’s three weeks old data. Tomorrow, we will have another slate of US labour market data with the release of the US ADP and Jobless Claims figures. Finally, on Friday, we conclude the week with the NFP report and the ISM Services PMI.


