USD
- The Fed left interest rates unchanged as expected at the last meeting with basically no change to the statement.
- Fed Chair Powell stressed once again that they are proceeding carefully as the full effects of policy tightening have yet to be felt.
- The US Core PCE last week came in line with forecasts with the disinflationary progress continuing steady.
- The labour market continues to show weakness as Continuing Claims are now rising at a fast pace with the last NFP report missing across the board. This week’s Job Openings and ADP came below forecasts. although the Jobless Claims were better than expected.
- The ISM Manufacturing PMI last week missed expectations falling further into contraction, while the ISM Services PMI beat forecasts holding on in expansion.
- The hawkish Fed members recently shifted their stance to a more neutral position.
- The market expects the Fed to start cutting rates as soon as Q1 2024.
AUD
- The RBA left interest rates unchanged as expected with the central bank maintaining the usual data dependent language.
- The recent Monthly CPI report missed expectations across the board which is a welcome development for the RBA.
- The RBA Governor Bullock has been leaning on a more hawkish side recently, although she remains optimistic on the future outlook.
- The labour market continues to weaken as seen also recently with the bulk of jobs added being part-time.
- The wage price index surprised to the upside as wage growth in Australia remains strong.
- The recent Australian PMIs fell further into contraction for both the Manufacturing and Services sectors.
- The market expects the RBA to start cutting rates in Q4 2024.
AUDUSD Technical Analysis – Daily Timeframe
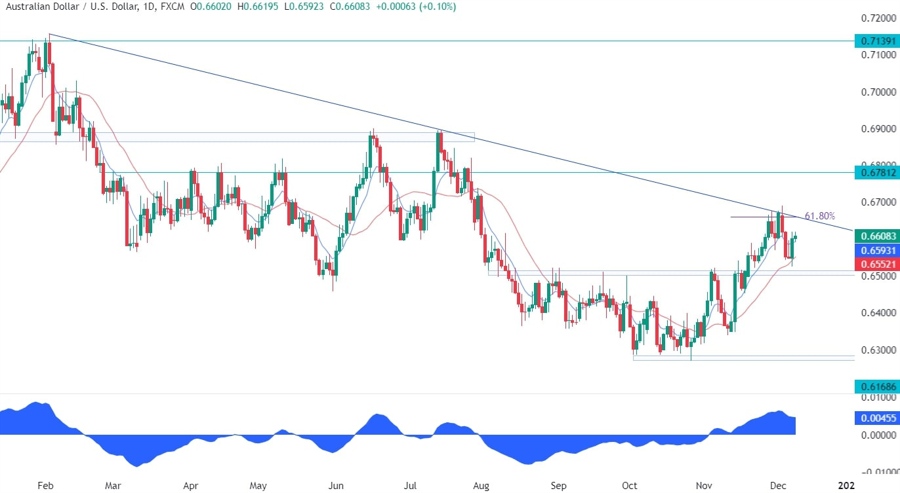
On the daily chart, we can see that AUDUSD sold off from the trendline into the key support zone around the 0.65 handle where the price bounced from yesterday. Things might start to get noisy here as the pair gets compressed between the key trendline and the support zone. A breakout on either side though, should offer a clear trading opportunity as on the upside we should rally into the 0.6780 level while on the downside we will likely fall back into the 0.63 handle.
AUDUSD Technical Analysis – 4 hour Timeframe
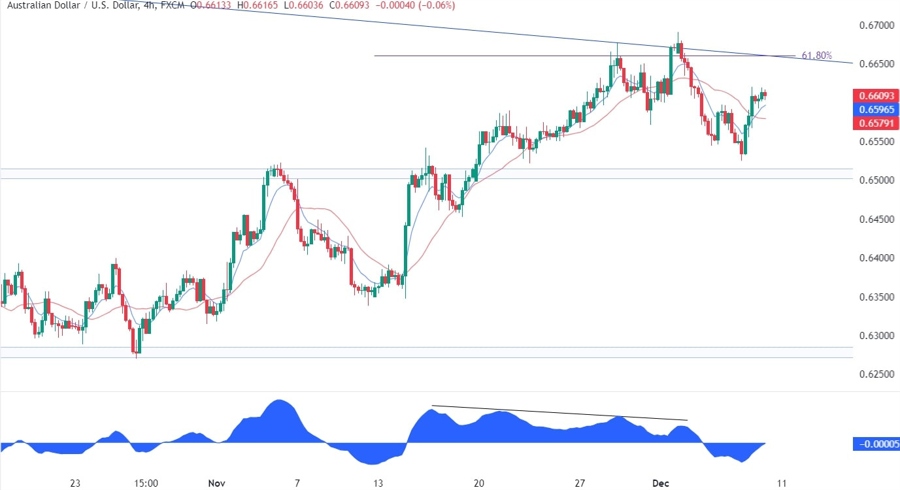
On the 4 hour chart, we can see that the price has been diverging with the MACD into the key trendline. This is generally a sign of weakening momentum often followed by pullbacks or reversals. In this case, we got the pullback into the key support zone and the bounce afterwards. The sellers should keep leaning on the trendline to position for a break below the support zone, while the buyers will likely continue to pile in around the support to position for a break above the trendline.
AUDUSD Technical Analysis – 1 hour Timeframe
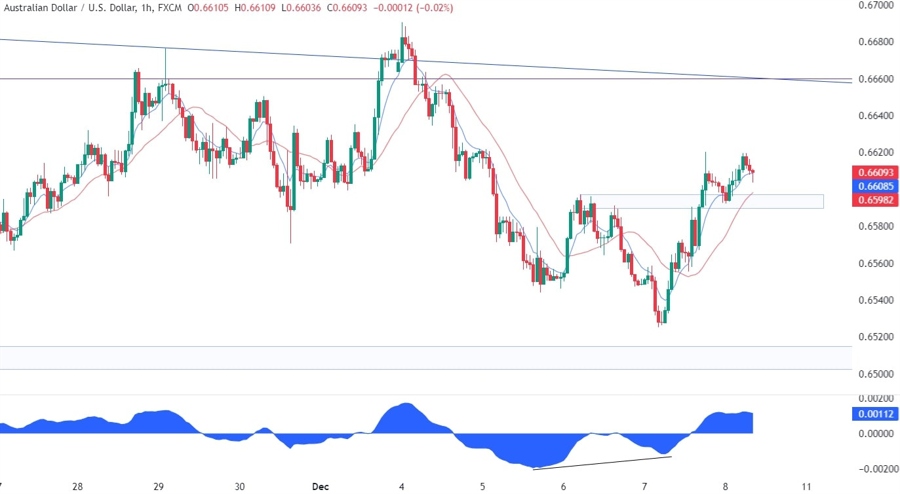
On the 1 hour chart, we can see that the latest leg lower diverged with the MACD right into the key support. This was another bullish confluence for the buyers to step in around the support zone to position for a rally into the trendline. Right now, we have a support zone around the 0.6593 level where we can find also the red 21 moving average for confluence. This is where the buyers might lean onto to increase the bullish bets into the trendline. The sellers, on the other hand, will want to see the price breaking lower to pile in and target a drop back into the support at 0.65.
Upcoming Events
Today all eyes will be on the US NFP report as it could increase the amount of rate cuts expected in 2024 or reverse some of them.


