USD
- The Fed left interest rates unchanged as expected with basically no change to the statement.
- Fed Chair Powell stressed once again that they are proceeding carefully as the full effects of policy tightening have yet to be felt.
- The recent US CPI missed expectations across the board bringing the expectations for rate cuts forward.
- The labour market is starting to show weakness as Continuing Claims are now rising at a fast pace and the recent NFP report missed across the board.
- The US Consumer Confidence and University of Michigan Consumer Sentiment continue to fall.
- The recent US ISM Manufacturing PMI missed expectations by a big margin, followed by a disappointing ISM Services PMI, although the latter remained in expansion.
- The US Retail Sales beat expectations, while the US PPI missed forecasts by a big margin.
- The recent Fedspeak has been leaning on the hawkish side, but this week’s inflation report pretty much confirmed that the Fed might be done for the cycle.
- The market doesn’t expect the Fed to hike anymore.
AUD
- The RBA raised the cash rate by 25 bps as expected as the central bank judged that the move was warranted to be more assured that inflation would return to target in a reasonable timeframe.
- The CPI report recently surprised to the upside prompting the market to price in a higher chance of another rate hike from the RBA in November, which is what we eventually got.
- The labour market continues to weaken as seen also recently with the bulk of jobs added being part-time.
- The wage price index surprised to the upside as wage growth in Australia remains strong.
- The Australian Manufacturing PMI fell further into contraction with the Services PMI plummeting back into contraction as well.
- The market expects the RBA to hold rates steady at the next meeting.
AUDUSD Technical Analysis – Daily Timeframe
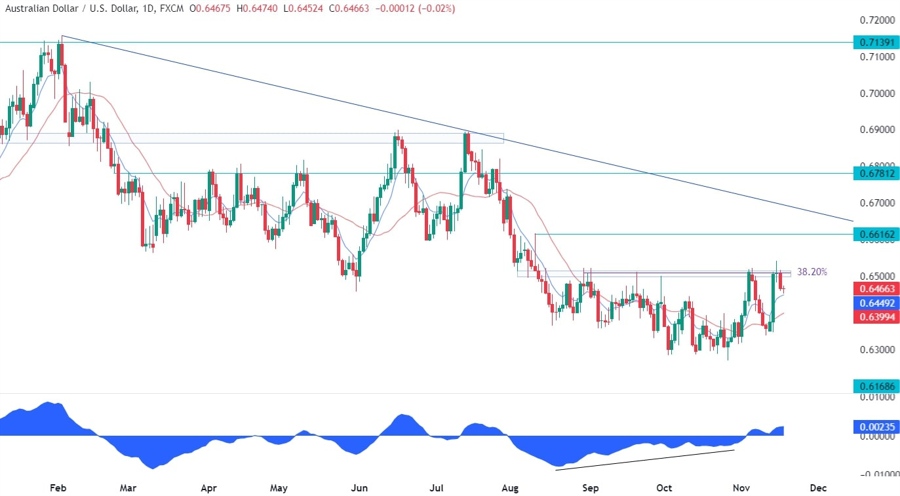
On the daily chart, we can see that AUDUSD rallied back into the key resistance around the 0.65 handle following the miss in the US CPI report. The sellers stepped in once again with a defined risk above the resistance to position for a drop into new lows. Overall, the price action remains rangebound, but the bias is still skewed to the upside.
AUDUSD Technical Analysis – 4 hour Timeframe
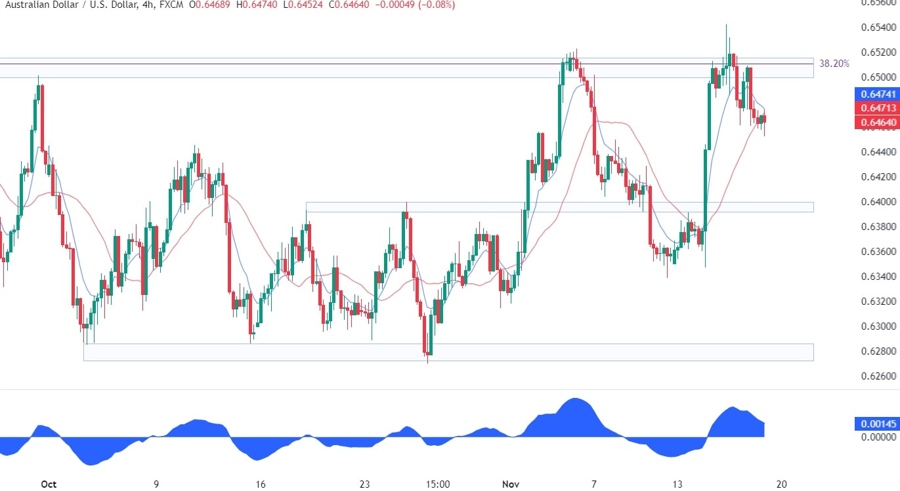
On the 4 hour chart, we can see more closely the rejection from the key resistance and the pullback into the red 21 moving average. Given the rangebound price action, there are no clear levels where to lean on except the boundaries of the range defined by the 0.65 resistance and 0.6280 support. In such instances, the market participants can either wait for a clear breakout or “play the range” by buying at support and selling at resistance.
AUDUSD Technical Analysis – 1 hour Timeframe
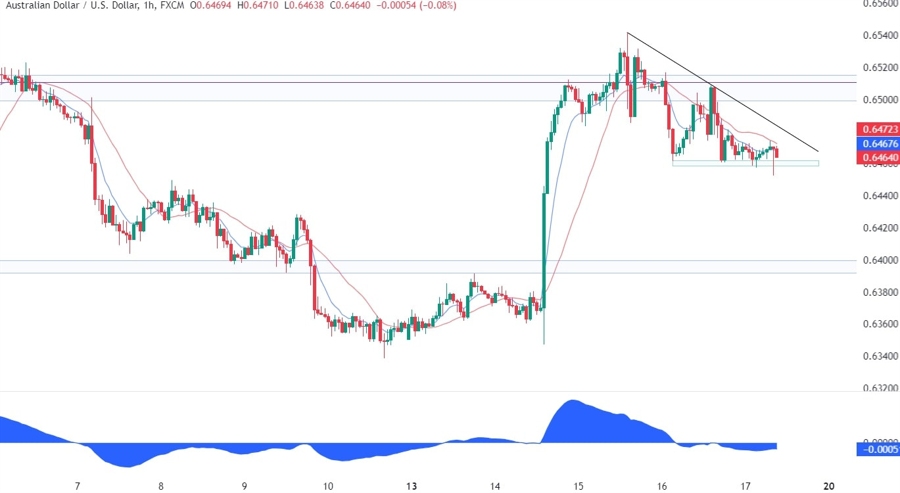
On the 1 hour chart, we can see that the consolidation below the resistance has formed what looks like a descending triangle with the counter-trendline and the support at 0.6460 defining the pattern. The price can break on either side of the pattern but what follows next is generally a sustained move in the direction of the breakout. In this case, if the price breaks to the upside, the buyers are likely to pile in to position for a break above the key resistance. Conversely, if the price breaks to the downside, the sellers will increase the bearish bets and target the 0.64 support.


