US
- The Fed left interest rates unchanged as expected with basically no change to the statement.
- Fed Chair Powell stressed once again that they are proceeding carefully as the full effects of policy tightening have yet to be felt.
- The recent US Core PCE came in line with expectations.
- The labour market is starting to show some weakness as Continuing Claims are now rising at a fast pace and the NFP data last Friday missed across the board.
- The US Consumer Confidence fell for the third consecutive month although the data beat expectations.
- The US ISM Manufacturing PMI last week missed expectations by a big margin, followed later on Friday with a disappointing ISM Services PMI, although the index remained in expansion.
- The market doesn’t expect the Fed to hike anymore.
Australia
- The RBA raised the cash rate by 25 bps as expected as the central bank judged that the move was warranted to be more assured that inflation would return to target in a reasonable timeframe.
- The CPI report recently surprised to the upside prompting the market to price in a higher chance of another rate hike from the RBA in November, which is what we eventually got.
- The RBA Governor Bullock downplayed the beat in the CPI data and made the market to pare back the rate hike bets.
- The labour market continues to weaken as seen also recently with the miss in the employment change and the losses in full-time employment.
- The Australian Manufacturing PMI fell further into contraction with the Services PMI plummeting back into contraction as well.
- The market expects the RBA to hold rates steady at the next meeting.
AUDUSD Technical Analysis – Daily Timeframe
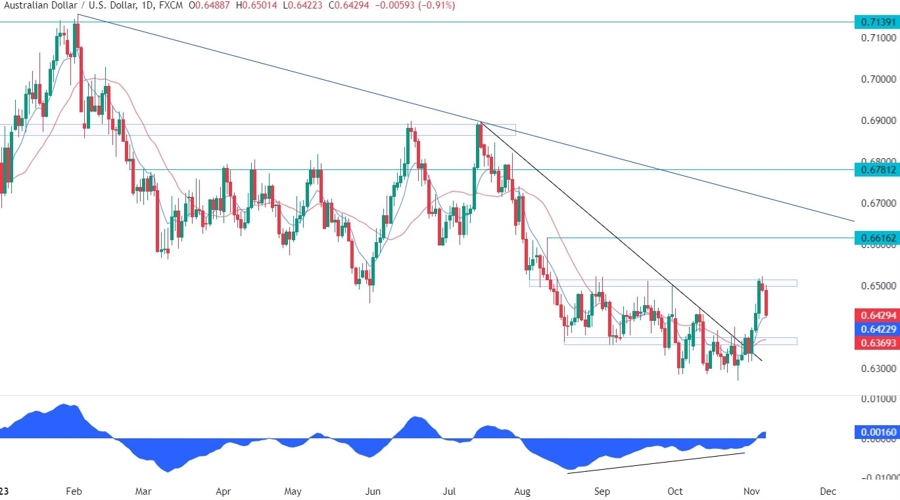
On the daily chart, we can see that the AUDUSD pair was already signalling a weakening bearish momentum given the strong divergence with the MACD. The breakout of the trendline gave the buyers more conviction to start pushing to the upside, which eventually ended in a test of the key 0.65 handle. The sellers leant on the resistance with a defined risk above it to position for a drop into the lows but the short-term bias has now turned bullish.
AUDUSD Technical Analysis – 4 hour Timeframe
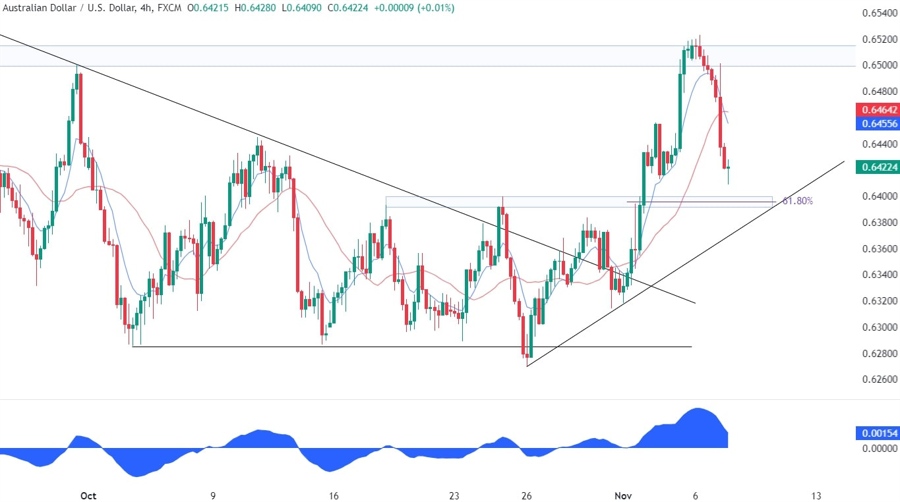
On the 4 hour chart, we can see the selloff from the key 0.65 resistance zone. From a risk management perspective, the buyers would be better off leaning on the upward trendline where they will have the 61.8% Fibonacci retracement level and the previous swing levels for confluence. The sellers, on the other hand, will want to see the price breaking lower to increase the bearish bets into the lows.
AUDUSD Technical Analysis – 1 hour Timeframe
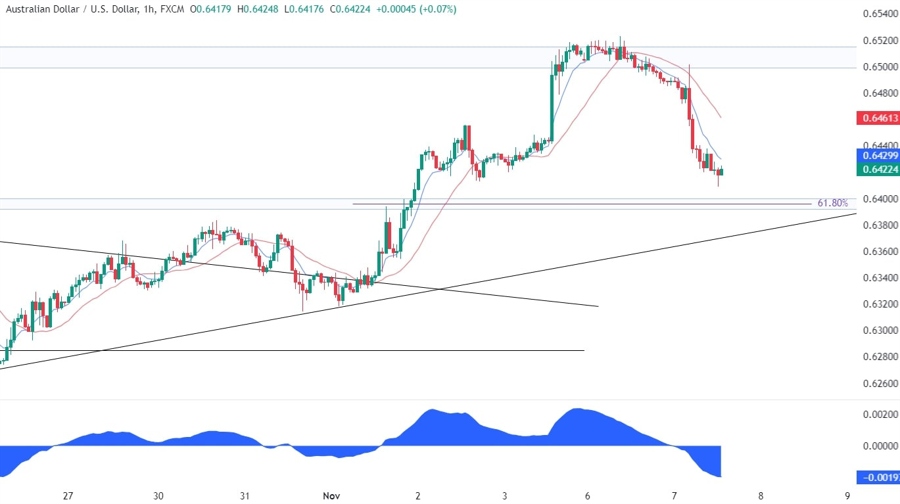
On the 1 hour chart, we can see that the bearish momentum is now starting to wane as the price is approaching the support zone. This is where the buyers are likely to start piling in with a defined risk below the trendline. The sellers, on the other hand, will wait for a break of the trendline before increasing the bearish bets into the lows.
Upcoming Events
This week is pretty empty on the data front with just the US Jobless Claims on Thursday and the University of Michigan Consumer Sentiment on Friday. The market is likely to focus on the US Jobless Claims on Thursday given the recent weakness in the labour market data.


