Last Friday's NFP report once again exceeded expectations, extending the remarkable streak to 14 consecutive beats on the headline number. However, a closer examination of the report reveals less promising aspects.
The unemployment rate experienced a notable jump from 3.4% to 3.7%, marking the largest month-over-month increase since the pandemic began. Additionally, there was a slight decline in the average number of hours worked per week, which often signals impending layoffs by employers.
Overall, the report offered something for everyone. The optimists viewed the solid job growth positively, but they also recognized that the higher unemployment rate and soft average hourly earnings could indicate reduced labour market tightness, potentially alleviating inflationary pressures. The decrease in average weekly hours worked may be interpreted as a return to the pre-pandemic trend.
On the other hand, pessimists focused more on the report's specifics rather than on the headline number. They emphasized the importance of trends rather than absolute figures.
In a separate development, the US ISM Services PMI released yesterday fell significantly below expectations at 50.3, narrowly missing the contraction territory. The employment sub-index contracted, and the prices paid sub-index experienced a substantial decrease, returning to levels last seen in May 2020. As a result, the market adjusted its expectations, lowering the likelihood of additional interest rate hikes by the Federal Reserve.
The Aussie jumped today as the RBA unexpectedly hiked rates by 25 bps again stating that further tightening may be required. All else being equal, we should see the pair trending upwards at least until the 0.6781 barring any hawkish surprise with the US CPI report next week.
AUDUSD Technical Analysis – Daily Timeframe
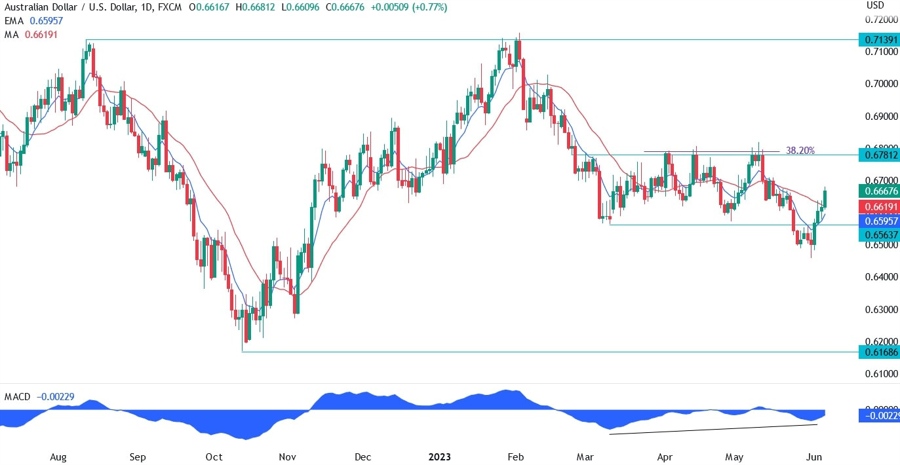
On the daily chart, the AUDUSD breakout of the 0.6563 support has clearly failed on the first attempt. As the price returned within the previous range, the buyers extended the rally towards new highs. The divergence between the two lows and the MACD was signalling some weakness in the bearish momentum, and in fact we got a reversal as the US data started to disappoint and flipped the hawkish bets on Fed’s rates path.
AUDUSD Technical Analysis – 4 hour Timeframe
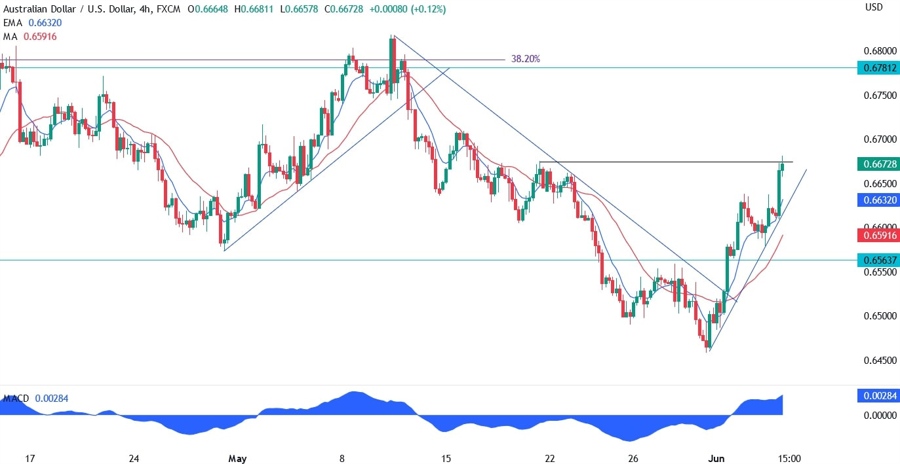
On the 4 hour chart, we can see that the break of the downward trendline ignited some more bullish momentum and the buyers piled in pretty aggressively extending the rally towards the 0.6640 level first, and after today’s RBA’s surprising hike, to the 0.6676 swing high level. We now have this short-term uptrend within the big range with the 0.6781 resistance as target. The moving averages will act as dynamic support for the buyers.
AUDUSD Technical Analysis – 1 hour Timeframe
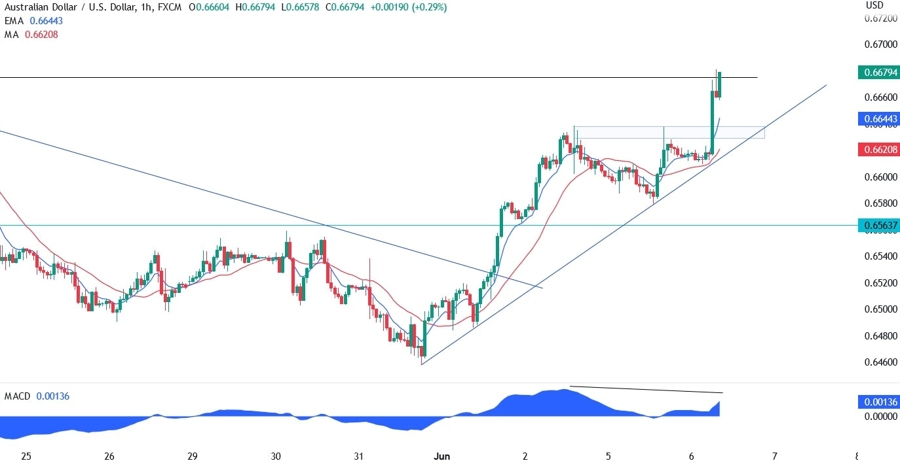
On the 1 hour chart, we have a divergence with the MACD right at the 0.6676 swing high level. We may find some sellers here looking for a pullback towards the trendline. That will be the spot where the buyers are likely to pile in. In fact, from a risk management perspective, the support area at 0.6635 offers a better risk to reward setup. We can find there the red 21 moving average, the previous swing high resistance turned support and the trendline. Naturally, a break below the trendline would see the sellers piling in more aggressively extending the fall towards the 0.6563 level first and the 0.6460 low next.
