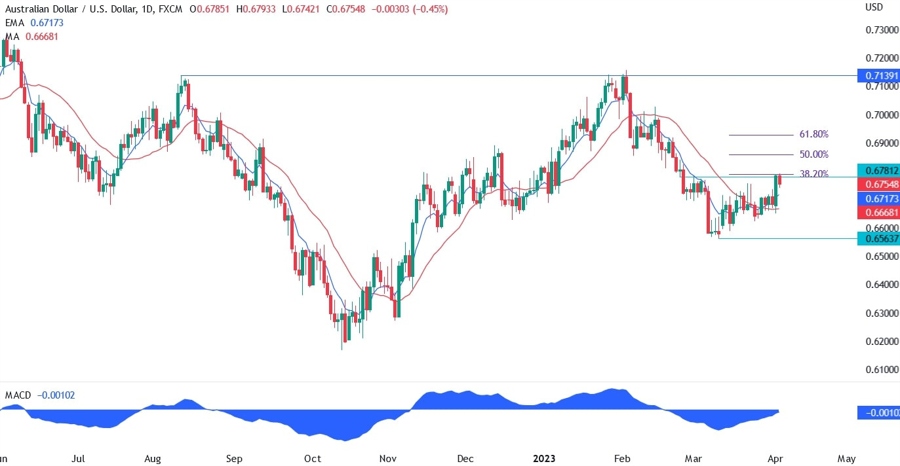
On the daily chart below, we can see that the price has rallied to the resistance at 0.6781 which has confluence with the 38.2% Fibonacci retracement level. The sellers are stepping in here with defined risk above and a big risk to reward trade in case the USD starts to gain momentum again.
These past weeks it was all an interest rates trade as the market is expecting the Fed to end its hiking cycle at the next meeting and start cutting rates soon after. But we may start to see the market switching to a recession trade, and in that case the US Dollar is sought as a safe haven. Yesterday, we got a very weak ISM Manufacturing PMI report, which may be an early sign that the events in the banking sector may have indeed impacted the economy.
AUDUSD technical analysis
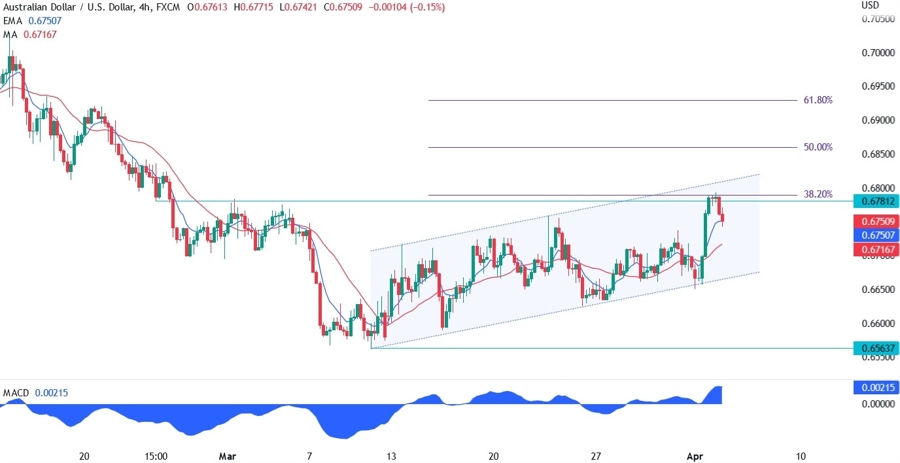
On the 4 hour chart below, we can see more closely the price rejecting the resistance and the fib level. Today, the RBA kept rates unchanged although the market was split on what to expect. So, the RBA may have already ended its hiking cycle.
This caused the pair to fall and the sellers may want to pile in here supported by this catalyst. Tomorrow we will also see the ISM Services PMI report and if that one tumbles as well, then we may see the USD back in vogue.
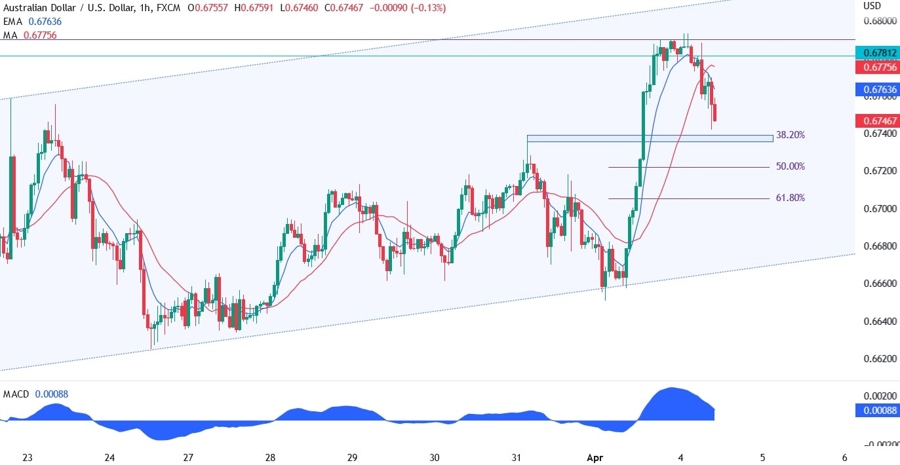
On the 1 hour chart below, we can see a possible support level for the buyers in case they want to fade the RBA reaction. We have the previous swing level and the 38.2% Fibonacci retracement level. The sellers may extend the selloff even more in case the price breaks below this zone and target the lower bound of the channel.
Ultimately, the sellers will want to see a break below the channel which would turn it possibly in a bear flag pattern and the room for a downside extension would be huge. The buyers will need the price to break above the resistance at 0.6781 to gain the conviction to target higher highs.