Adobe reports earnings next Wednesday, with expectations calling for EPS of $5.39 on $6.11 billion in revenue. That compares with $4.81 and $5.61 billion a year ago—an increase of 12% in EPS and 8.9% in revenue. Those are solid year-over-year gains, especially given the stock’s performance this year.
Shares jumped 5.67% today (up $18.64 to $347.47), marking the largest one-day gain since April 8. Even with that surge, Adobe remains down -21.87% year-to-date. From the January 2024 high of $638.25, the stock fell more than 50% to a low of $311.58, a decline that has left many traders wondering whether the selloff has finally run its course. Today’s buying suggests that some believe it has.
CNBC’s Josh Brown added to that sentiment, noting that he recently took a long position. He emphasized he has a stop in place but argued that fears of AI making Adobe’s products obsolete are largely exaggerated.
But what about the technical picture?
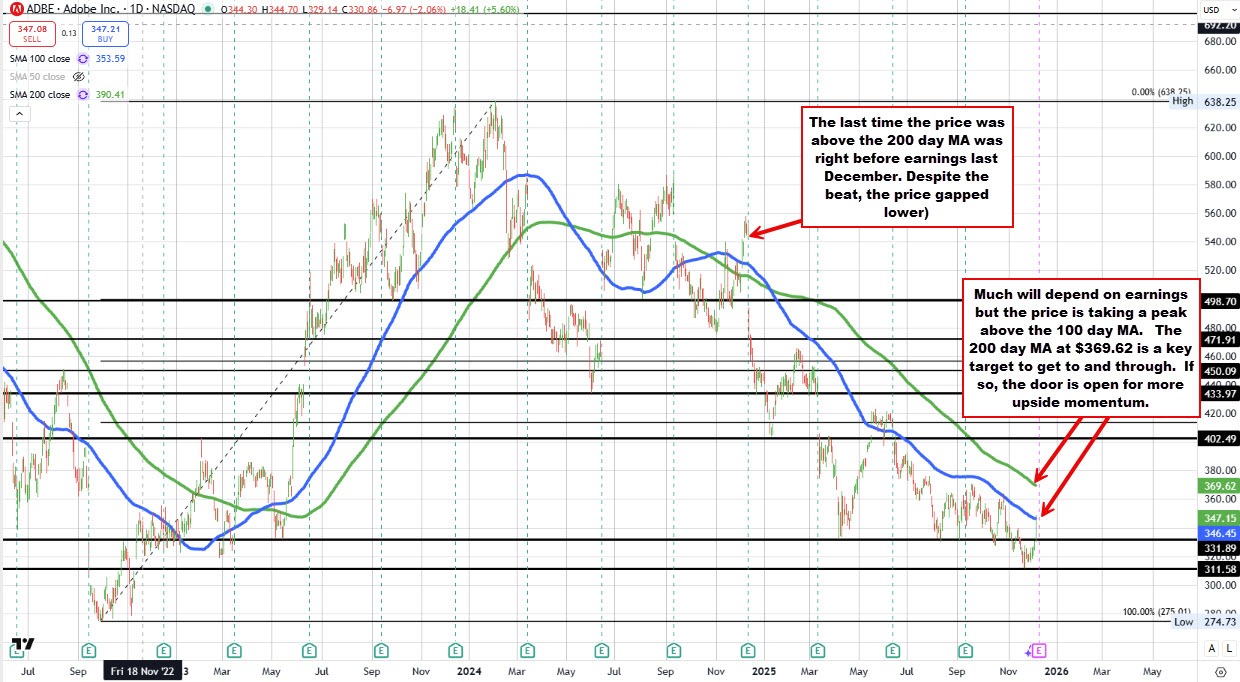
Looking at the daily chart above, today’s rally has pushed Adobe just above the falling 100-day moving average at $346.45. That’s a meaningful development. The last time the stock poked above this level—on October 28—it failed quickly, reversing lower and beginning the slide that ultimately led to the 2024 low at $311.58 on November 21. For buyers, simply touching the 100-day moving average isn’t enough; getting above it and staying above it is what shifts the broader bias in their favor.
If the price can hold the break, the next major daily target is the 200-day moving average at $369.62. A move above that level would have traders looking toward $400.
Notably, the stock has not traded above the 200-day MA in roughly a year—just before the same earnings report that will come out this Wednesday. The backdrop then was very different: the stock traded near $586, EPS and revenue beat expectations, but the reaction was weighed down by concerns about AI competition and rich valuation. Today, the stock is nearly $240 lower, and those headwinds may carry less force.
On the hourly chart, today’s surge also pushed the price above the 200-hour moving average at $331.04, reinforcing the bullish short-term momentum. That follows last week’s move above the 100-hour moving average at $324.19, giving buyers two nearby levels that now define risk heading into earnings.
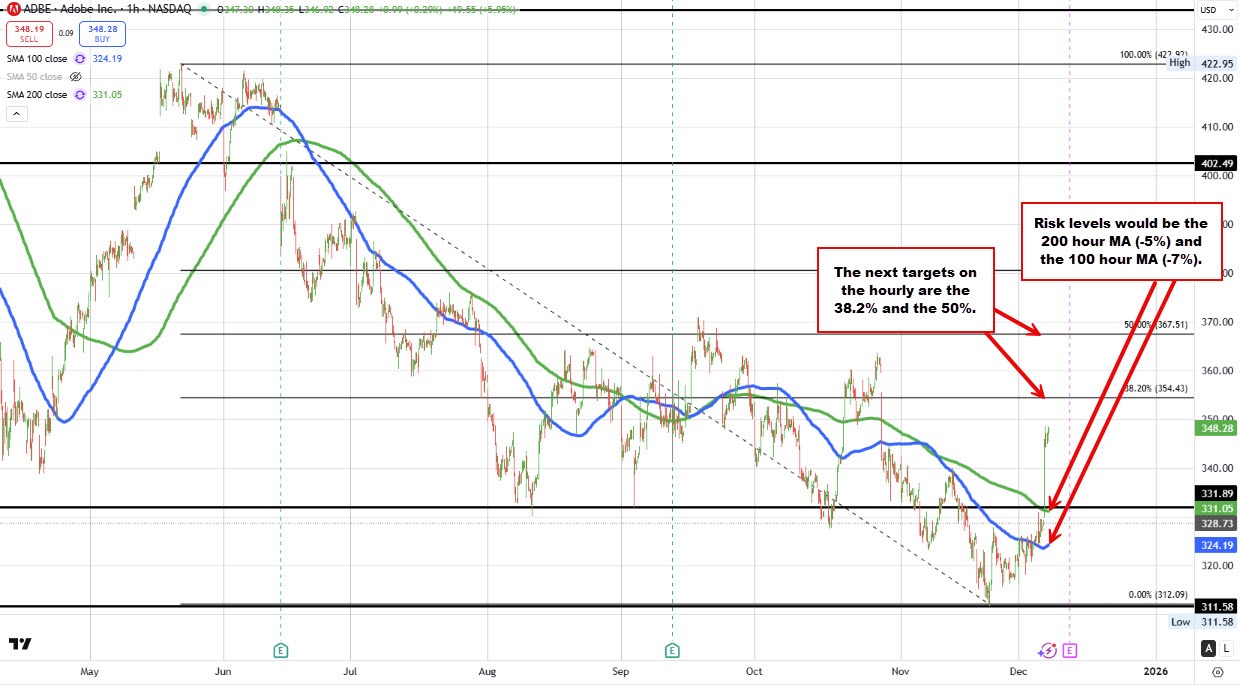
A drop back below the 100-hour MA would represent a pullback of roughly 7% from current prices, while a fall below the 200-hour MA implies a downside risk of about 5%. For traders, those two levels provide a clean technical roadmap as the market heads into a high-stakes earnings release.
Buyers are making a push, but next week’s earnings will ultimately set the tone. On a year-over-year basis, expectations look solid: EPS is projected to rise 12%, revenues are expected to climb 8.9%, and yet the stock is trading roughly $250 below where it was a year ago. That combination suggests that valuation concerns—at least on a relative basis—may be less of an issue than they were before.
There is lingering hesitation around competitive pressures from AI, and any commentary hinting at market-share erosion could weigh on the stock. Still, for traders willing to risk 5%–7% on the downside in exchange for the potential upside of a move toward $400 or higher(14-15%) the risk-reward may be attractive.
